
")


Free Funnel Audit
Convert more customers today!
SEO
10 mins read

SEO
10 mins read
Reporting on ad campaign results can feel confusing at first. Marketing teams collect large amounts of data every day. Without the right structure, this data quickly becomes overwhelming. One unclear report can easily lead to wrong budget decisions, wasted ad spend, and missed growth opportunities.
Clear reporting helps teams understand what truly works. It shows which campaigns drive results and which ones need improvement.
This guide makes reporting simple and clear. Here you will learn what to include and why it matters. You will also learn how to keep reports short and easy. Later, we have also covered key metrics, real examples, and reporting workflows, keeping everything practical, simple, and easy to use.
If you want faster and smarter reporting support, visit CausalFunnel today and simplify your campaign reporting process.

Reporting on ad campaign results means explaining campaign performance clearly. It is more than exporting numbers from ad platforms.
A good report shows what happened and why. It also shows what should happen next. That is why strong reporting saves time and money.
Many people confuse dashboards and reports very often. A dashboard helps you watch performance in real time, but a report explains results for a set period. Again, a dashboard shows data and trends quickly, while a report explains the context, insights, and next actions.
A useful ad campaign report usually does three things:
This difference matters when sharing results with stakeholders, who need clear answers, not just platform screenshots. Teams need priorities, not a long list of metrics.
When reporting on ad campaign results, always keep context first. Because numbers without context often create confusion and wrong decisions. That is where many weak reports fail badly.
Good reporting campaign performance supports smart budget decisions. It shows which campaigns deserve more spending next month, and which campaigns need changes or pauses. Without reporting, teams often repeat weak ad decisions.
Clear reporting also improves trust across the business. Clients feel calmer when they understand campaign progress, leaders approve budgets faster when results are explained clearly, and internal teams work better when priorities stay visible.
Here are key reasons reporting matters every time:
A strong ad performance report also protects your strategy. Sometimes, results look weak during early learning periods. Good reporting explains why short-term results can happen. It also shows what signals suggest future gains. That helps others avoid rushed and harmful decisions.
Reporting also improves communication with different audiences. Each audience needs a different level of detail. For example, a marketer needs deeper campaign and creative details, while an executive needs outcomes, risks, and next steps. A client may need both a summary and an action plan.
If you need better reporting systems and automation, check CausalFunnel. Our team can help you organize campaign insights more clearly and present them in a simple format. We help you turn raw ad data into a dashboard that is easier to read and act on. That means faster decisions, cleaner reporting workflows, and better communication with clients and teams.

A strong ad campaign report should follow a clear structure, because that makes it easier to read and trust. Using the same order each time also makes comparisons easier across reporting periods. Start with the campaign goal before showing any metrics, so the report stays focused from the first line. Every metric should clearly connect to that goal.
This structure works for most paid ads reporting needs. You can adjust details by campaign goal and funnel stage. A lead generation report needs different details than awareness reporting. That is normal in digital marketing reporting.
Quick rule for better reports: Do not include every available metric in reports. Include only metrics that support decisions and action.
Use this table as a quick planning tool before you build the report. It gives your team a simple campaign report template to follow. The format keeps reports clear, consistent, and easy to scan.
Report Section | What to Include | Why It Matters |
Campaign Goal | Leads, sales, traffic, or awareness goal | Keeps all metrics tied to purpose |
Date Range | Reporting dates and comparison period | Adds context and trend meaning |
Budget & Spend | Planned budget, actual spend, pacing | Shows budget control and efficiency |
KPI Scorecard | Main results only, not all metrics | Makes the report easy to scan |
Channel Breakdown | Performance by platform or campaign | Finds winners and weak areas |
Creative Insights | Best ads, weak ads, fatigue signs | Improves messaging and design decisions |
Audience Insights | Top segments and placements | Helps with targeting and budget shifts |
Key Takeaways | Summary of performance drivers | Saves time for busy stakeholders |
Next Actions | Specific steps for optimization | Turns data into action quickly |
A report should answer real business questions first. That is how you make reporting campaign performance valuable. Readers care about decisions, not only data volume.
Write your report for the person reading it. Think about what they need to know next. Then choose the right depth and format.
This approach makes your ad performance report easier to trust. It also reduces follow-up questions after every report.
Many teams make the same reporting mistakes often. These mistakes hurt clarity and slow decision-making badly. Avoiding them will improve your reports quickly.
Good reporting on ad campaign results always includes interpretation. They do not stop at clicks, spend, and impressions. They explain what the results mean for decisions.
Not every campaign needs the same metrics. Your metric choices should match the campaign goal. This is a core rule for paid ads reporting to keep your report focused and easy to understand.
This goal-based view improves campaign results analysis.
This structure makes your ad campaign report stronger. It also helps non-marketers understand performance much faster.
Awareness campaigns aim to reach the right people. They usually do not target immediate conversions first. That is why a conversion-only judgment can be misleading. Your report should explain this very clearly.
If impressions are high but reach is low, you may be showing ads to the same people again and again. That usually means frequency is rising too fast. High frequency can lower response over time. It can also signal creative fatigue or tight targeting.
A low CPM can look great at first. But cheap impressions do not mean the campaign is working. You still need solid reach and the right audience. Always review CPM with reach and frequency together.
In your report, add short notes here. Explain what changed and why it matters. This makes your ad performance report more useful.

Engagement metrics show interest and response behavior. They matter in traffic and consideration campaigns most. They also help diagnose ad message strength quickly.
A high CTR often signals strong ad relevance. It can also signal a strong headline or offer. Still, CTR alone does not prove business value. You must check the landing page and conversion results too.
A low CPC can be helpful and efficient. But cheap clicks may still be low quality. So, pair CPC with conversion rate and lead quality. This creates better campaign results analysis overall.
High clicks with weak landing page views may appear. That can signal slow pages or tracking issues. It can also signal accidental clicks on mobile placements. Always mention likely causes in the report summary.
Conversion metrics show real business progress clearly. These metrics matter most for lead and sales campaigns. This is often the core of a campaign performance report. Readers usually care about this section the most.
High CTR with low conversion rate is common. That usually points to offer or landing page issues. It may also signal weak audience targeting quality. Your report should state the likely reasons clearly.
Low CPA is usually a strong result, but low CPA with poor lead quality is risky. Always add lead quality notes when possible to improve trust in your ad campaign report.
Conversions can drop while efficiency improves sometimes. That may happen after budget cuts or tighter targeting. Explain this tradeoff in simple terms for readers. Good reporting shows tradeoffs without hiding details.
Revenue metrics matter in sales-focused ad campaigns. These metrics guide scaling and budget allocation decisions. They are key for e-commerce and paid sales teams. They also matter in monthly campaign report reviews.
High ROAS can still hide growth limits. Sometimes retargeting drives strong ROAS but low scale. Prospecting may show lower ROAS but build demand. Explain this balance in your report summary.
Revenue growth with rising CPA may still work. This depends on margins and customer value. Always add context before judging efficiency trends. That makes your digital marketing reporting much stronger.
Use this table when building your report faster. It helps match metrics to campaign goals quickly.
Campaign Goal | Primary Metrics | Support Metrics | Main Reporting Question |
Awareness | Reach, Impressions, CPM | Frequency, Video Views | Did enough target users see the ads? |
Traffic / Consideration | Clicks, CTR, CPC | Landing Page Views, Engagement Rate | Did the ads drive quality interest? |
Lead Generation | Conversions, Conversion Rate, CPA | Qualified Leads, CTR, CPC | Did we generate efficient, useful leads? |
E-commerce Sales | Revenue, ROAS, Purchases | AOV, Conversion Rate, CPA | Did ads drive profitable sales growth? |
Metrics become much more useful when you add context. That context includes your goal, date range, budget, and comparisons. Without that context, numbers can tell the wrong story. This is where many reports lose trust very quickly.
Use these simple interpretation rules every time:
Here is a simple example for reporting:
CTR improved, but the conversion rate dropped sharply. This may mean better ad clicks, weaker landing pages. It may also mean a broader traffic quality declines. Your report should suggest a landing page test next.
Another example is common in sales campaigns:
ROAS may fall while total revenue keeps rising. This can happen during audience expansion tests. Your report should explain scale versus efficiency tradeoffs. That creates better reporting on ad campaign results examples.
Do not report every platform metric available. That makes the report hard to scan. Choose metrics that support real business decisions. This keeps your reporting campaign performance useful.
Avoid these common mistakes in metric sections:
These mistakes reduce trust in your report and lead to poor optimization decisions later. Clear notes and fair comparisons fix this problem.
If you want better reporting workflows, visit CausalFunnel today. We support cleaner analysis and easier reporting processes.
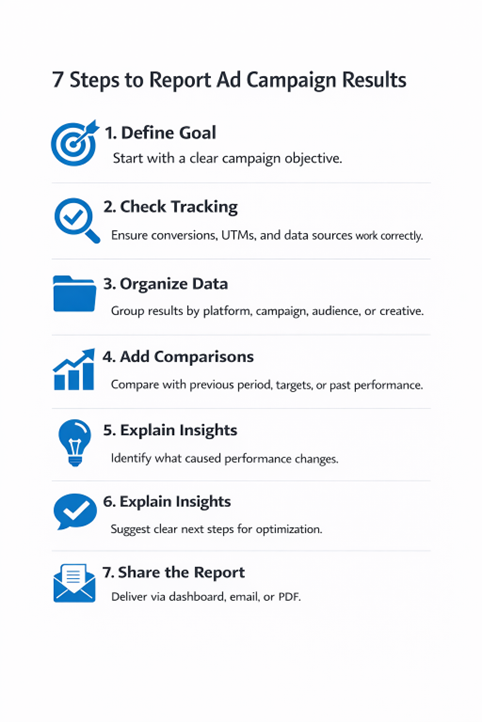
A strong report follows a repeatable process each time. This saves time and improves report quality over time. It also makes team handoffs much easier later.
Start with the campaign goal before pulling data. This is the most important reporting step. Your goal decides which metrics matter most. It also shapes the report summary and actions.
Examples of clear campaign goals include:
Write the goal in one short sentence, and place it near the top of the report. This keeps every section focused and useful.
Next, confirm your tracking setup is working correctly. Bad tracking creates bad reports and wrong decisions. Check platform tracking before you trust the numbers.
Review these items before reporting campaign performance:
Add a note if tracking has any limits to protect trust, and avoid future confusion. Good reports explain data limits very clearly.
Now pull data from your ad platforms, then group the data for easy reading. Do not paste raw exports into your report that creates clutter and slows down every reader.
Group data by useful reporting levels:
Use the level that supports decisions best. Executives need less detail than media buyers, while clients often need a summary plus a few examples.
Numbers alone are not enough for good reporting. You need context to explain what changed. This is where many reports become truly useful.
Use these comparison types when possible:
Choose fair comparisons every single time. Do not compare unlike campaigns without warning. That leads to weak conclusions and poor actions.
This step turns data into insight and action. It is the heart of a strong ad campaign report. Readers remember explanations more than raw numbers.
Use simple cause-and-effect statements in your summary. Keep your language clear and direct always.
Examples of strong explanations:
These statements help teams act faster next, and reduce follow-up questions after meetings.
Every report should end with clear recommendations. Without this step, reports feel incomplete and passive. Readers need to know what to do next.
Keep recommendations specific and easy to act on. Avoid vague advice like “optimize campaign performance.”
Use action-focused recommendations like these:
This makes your ad performance report much stronger. It also shows strategic thinking, not just reporting.
The final step is report delivery. Format matters more than many teams expect. A strong report fails when delivery is poor.
Choose the best format for the audience:
Dashboards help teams monitor live performance changes. Emails help busy readers scan key updates quickly. PDF files help present formal monthly campaign report reviews.
Now, let us explore practical reporting on ad campaign results examples. Each example shows metrics, meaning, and next steps clearly. Use these models to improve your own reports.
Goal: Generate qualified demo requests at an efficient cost.
Period: One-month campaign review period.
Reported metrics:
What the results showed:
CTR improved after the new ad copy launched. Landing page views also increased during the same period. Lead volume increased, but the qualified lead rate fell. CPA stayed stable despite more total leads.
What this means:
The ads attracted more clicks and more leads. However, targeting or messaging became slightly broader. That likely reduced lead quality in the funnel.
Next actions:
This is a strong campaign results analysis example. It shows volume, quality, and efficiency together.
Goal: Increase sales revenue while keeping a healthy ROAS.
Period: Monthly performance review.
Reported metrics:
What the results showed:
Revenue increased after the budget expansion started. Purchase volume also increased across prospecting campaigns. ROAS dropped slightly during the same period. Retargeting still delivered the highest ROAS result.
What this means:
Scaling helped drive more total revenue growth. Prospecting efficiency dropped, which is often expected. Retargeting remained efficient but offered limited scale.
Next actions:
This ad campaign report example explains tradeoffs clearly. That helps teams avoid wrong budget decisions quickly.
Goal: Expand reach in a new target region.
Period: Four-week awareness campaign.
Reported metrics:
What the results showed:
Reach grew steadily in the first two weeks. Frequency rose sharply during the last week. CTR dropped slightly as frequency increased. CPM remained stable across the campaign period.
What this means:
The campaign delivered broad awareness successfully. However, rising frequency suggests creative fatigue risk. The audience may have seen the same ads often.
Next actions:
These reporting on ad campaign results examples help readers learn faster. They show what to report and how to explain it.
A clear template makes reporting faster and better. It also creates consistency across teams and clients. Use this format for most paid ads reporting work.
This structure works for a campaign report template. It also supports cleaner digital marketing reporting workflows.
Different readers need different report formats. This table helps you choose the best format. It also improves clarity and response speed.
Audience | Best Format | What They Need Most | Recommended Length |
Executive team | PDF summary or email | Outcomes, risks, next steps | Very short |
Client | PDF plus dashboard link | Progress, insights, recommendations | Short to medium |
Marketing manager | Dashboard plus summary notes | Trends, winners, actions | Medium |
Performance specialist | Dashboard with deep breakdowns | Diagnostics, tests, optimization details | Medium to detailed |
Many reports fail in the final summary section. The numbers may be correct, but unclear. That hurts trust and slows the next decision.
Avoid these mistakes in your final reporting flow:
A strong report stays honest and useful. It shows wins, losses, and learning points clearly. That is how great reporting builds long-term trust.
Use this checklist before sharing any report to improve quality and readability quickly. Make sure that:
This checklist improves reporting campaign performance every time. It also helps teams train new members faster.
If you want better reporting systems and support, visit CausalFunnel. We can help your team turn raw ad data into clear, action-ready reports faster. That means less time building reports and more time improving campaign results.
You now have a full reporting framework to use. Use it to build clearer reports, faster decisions, and stronger campaigns. Because when your reports stay clear and useful, your results improve over time.
Content marketing for startups does not generate instant results. Expect early signals within 3–6 months. Consistent publishing, distribution, and optimization produce measurable ROI around 6–12 months. Patience is essential to benefit from compounding content effects.
The budget depends on goals and resources. Focus on a lean startup content strategy that maximizes high-impact channels. Prioritize quality over quantity. Invest in promotion and small-scale paid campaigns to accelerate visibility when necessary.
Outsourcing can help if internal bandwidth is limited. Freelancers or agencies should complement, not replace, strategy execution. Ensure outsourced content aligns with buyer intent, funnel stages, and authority-building requirements to avoid wasted spend.
Track meaningful metrics: lead conversions, CTA engagement, time on page, and scroll depth. Avoid vanity metrics. Attribution models clarify which content drives pipeline influence, ensuring content marketing for startups produces tangible growth.
Start using our A/B test platform now and unlock the hidden potential of your website traffic. Your success begins with giving users the personalized experiences they want.
Start Your Free Trial
Empowering businesses to optimize their conversion funnels with AI-driven insights and automation. Turn traffic into sales with our advanced attribution platform.
Trusted by Customers


©CausalFunnel Inc. All rights reserved.