
")


Free Funnel Audit
Convert more customers today!
SEO
10 mins read

SEO
10 mins read
Tracking funnel conversion rates matters more now than ever before. If you want predictable growth in B2B SaaS, understanding funnel performance is essential. Without solid benchmarks, teams end up guessing and optimizing blind. With real data, you can set meaningful goals and improve performance systematically. That’s why we created this guide on b2b saas funnel conversion benchmarks for 2026.
In this guide, we share benchmarks for every major funnel stage. You’ll get real numbers and actionable strategies you can use today. We also break this down by company size, channel, and segment. Let’s start from the fundamentals.
All benchmarks in this blog are based on real industry research, publicly available reports, and SaaS benchmarking studies. No data has been fabricated or estimated. Numbers reflect aggregated industry insights from trusted B2B SaaS research sources and conversion benchmark publications.
These sources directly informed:
A funnel conversion rate is the percentage of prospects who move from one stage of your funnel to the next. In B2B SaaS, sales and marketing leaders use these to predict revenue, optimize growth, and align teams.
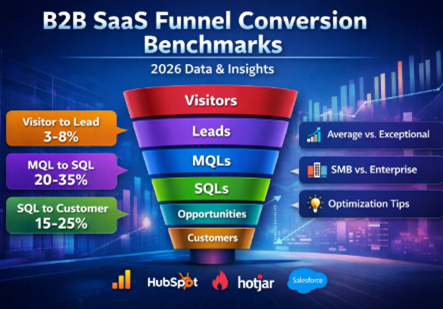
A typical B2B SaaS funnel includes stages like:
We often shorten this to top‑of‑funnel, mid‑funnel, and bottom‑funnel stages. Each stage has its own challenges and benchmarks.
These are often called B2B SaaS funnel metrics or SaaS conversion stages.
Visitor
↓
Lead
↓
MQL
↓
SQL
↓
Opportunity
↓
Customer
↓
Expansion
Understanding each stage helps you spot leaks where you lose prospects. It also shows where you should focus optimization efforts.
Benchmarks are more than industry noise. They help you:
Here’s how benchmarks help in real life:
Benefits of benchmarking:
Benchmarks help you avoid unproductive practices and focus on what works.
Here is the fresh 2026 data on conversion rates. These represent averages, strong performers, and exceptional outcomes across the B2B SaaS industry. Data is drawn from multiple recent SaaS benchmarking sources.
Performance Tier | Conversion Rate |
Average | 1.5%–2.5% |
Strong | 3%–5% |
Exceptional | 8%–15% |
Quick insight: Top companies convert nearly 10x more visitors than the average.
Metric | Conversion Rate |
Average | ~37%–41% |
Strong | 45%+ |
Weak | <20% |
This stage depends on lead quality and ICP (ideal customer profile) alignment.
Performance Segment | Conversion Rate |
Average | 32%–42% |
Top 10% | ~50%+ |
Lower‑performing | <25% |
This stage separates real buyers from casual interest.
Tier | Conversion Rate |
Average | 40%–48% |
High Performers | 50%+ |
Lower Quartile | <30% |
Getting prospects into opportunities tells you how well sales is qualifying SQLs.
Category | Conversion Rate |
Average | 31%–39% |
Strong | 40%+ |
Weak | <20% |
This depends heavily on pricing, product value, and sales execution.
Size / Stage | Visitor → Lead | MQL → SQL | SQL → Opportunity | Close |
SMB ($10M–$100M ARR) | ~1.4% | ~39% | ~42% | ~39% |
Enterprise ($1B+ ARR) | ~0.7% | ~40% | ~36% | ~31% |
Enterprise deals move slower and convert at lower percentages. SMB markets convert faster but may pay less per deal.
Channel | Visitor → Lead | MQL → SQL |
SEO | ~2.1% | ~51% |
PPC | ~0.7% | ~26% |
Webinar | ~2.2% | Varies |
Organic traffic usually converts better through the funnel than paid traffic because intent is clearer.
Benchmarks also vary by niche. For example:
SaaS Specialty | Visitor → Lead | MQL → SQL | Opportunity → Close |
CRM Software | ~2.0% | Strong | ~38% |
Cybersecurity SaaS | Lower top‑funnel | Moderate | High deal value |
Hospitality SaaS | ~1.6% | Moderate | ~31% |
Legaltech SaaS | ~1.8% | Strong | ~38% |
These differences reflect buyer cycles, urgency, and product complexity.
For instance, cybersecurity tools often involve more stakeholders and longer evaluations. CRM tools attract broad interest and therefore higher top‑funnel rates.
Companies focused on regulated industries (like hospitality or legal) may convert lower at the top of the funnel but do better lower down.
Understanding these differences helps you tailor your funnel expectations. It also prevents unfair comparisons between unrelated SaaS products.
Not all B2B SaaS funnels work the same way. Conversion benchmarks change significantly based on your go-to-market model. Product-led growth, sales-led, and demo-led companies follow different buyer journeys, buyer intent levels, and conversion behaviors.
Understanding these differences prevents bad benchmarking. It also helps teams set realistic targets that fit their growth model.
Product-Led Growth (PLG)
Users experience the product before talking to sales. Free trials, freemium models, and self-serve onboarding drive growth.
Sales-Led SaaS
Sales teams control the funnel. Relationships, outbound, and account-based selling dominate growth.
Demo-Led SaaS
Prospects request demos early. Sales conversations happen before product experience.
Funnel Stage | PLG SaaS | Sales-Led SaaS | Demo-Led SaaS |
Visitor → Lead | 3%–9% | 0.5%–1.5% | 1%–3% |
Lead → MQL | 45%–65% | 25%–40% | 35%–50% |
MQL → SQL | 35%–55% | 30%–45% | 40%–60% |
SQL → Opportunity | 45%–60% | 35%–50% | 50%–65% |
Opportunity → Customer | 20%–35% | 30%–45% | 35%–50% |
Customer → Expansion | High | Moderate | Moderate–High |
PLG Funnels
PLG companies convert more users at the top of the funnel. Activation and product experience drive buying intent. Revenue depends heavily on retention and expansion.
Sales-Led Funnels
Sales-led funnels convert fewer leads at the top. Deal sizes are larger and cycles are longer. Conversion quality matters more than volume.
Demo-Led Funnels
Demo-led funnels filter buyers earlier. Conversion rates improve in later stages. Sales efficiency becomes the main growth driver.
If you run a PLG model:
If you run a sales-led model:
If you run a demo-led model:
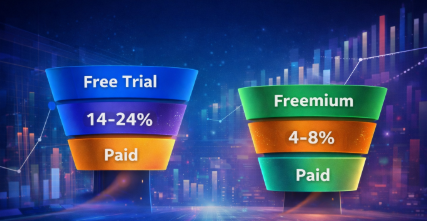
Free trials and freemium models create a very different funnel structure. Instead of converting leads through sales conversations, the product becomes the main conversion engine. Activation, onboarding, and value realization replace traditional sales stages.
That makes trial-to-paid and freemium-to-paid conversion rates some of the most important benchmarks in modern SaaS.
Below are 2026 benchmark tiers using three performance levels:
Performance Tier | Conversion Rate |
Satisfactory | 5% |
Good | 10%–15% |
Excellent | 20%–25% |
Performance Tier | Conversion Rate |
Satisfactory | 1% |
Good | 3% |
Excellent | 8%–10% |
Freemium models always convert lower than trials because intent is weaker at signup.
Free trials convert higher because users already show buying intent. Freemium models scale volume, but revenue depends on long-term activation and expansion. Vertical complexity matters, since buying urgency differs across industries.
Inbound and outbound funnels behave very differently in B2B SaaS. Buyer intent, trust level, and sales readiness vary strongly based on how leads enter your funnel. Comparing them directly gives clearer insight than using blended averages.
Inbound leads usually arrive with problem awareness and intent. Outbound leads usually start with low intent and high education needs. This changes conversion performance at every stage of the funnel.
Funnel Stage | Inbound Leads | Outbound Leads |
MQL → SQL | 40%–55% | 20%–35% |
SQL → Opportunity | 45%–60% | 30%–45% |
Opportunity → Close | 30%–40% | 18%–30% |
Inbound funnels convert better at every stage because buyer intent is already present. Outbound funnels require more education and trust-building before conversion happens. Outbound success depends more on volume and targeting, while inbound depends more on content and intent alignment.
Inbound is conversion-efficient. Outbound is pipeline-volume driven.
Benchmarks are only useful when you act on them. Here are actionable ways to improve at each stage:
Here’s a quick checklist you can follow:
Top‑of‑Funnel Playbook
Mid‑Funnel Playbook
Bottom‑Funnel Playbook
The right tactics depend on your funnel stage gaps.
Even experienced teams slip up here. Avoid these pitfalls:
Benchmarks only matter if companies are similar in product, price, and target audience.
Conversion rates vary by quarter, industry cycles, and economic conditions.
Clicks, engagement, and content interactions matter too. They predict deeper funnel movement.
Actionable tips:
To measure each stage accurately, use proven tools like:
These tools help you build B2B SaaS funnel tracking tools dashboards and gain real‑time visibility. They also integrate with data warehouses and analytics layers for deeper insights.
Here’s what we’ve learned:
Action Plan (Start today):
Benchmarks provide direction; your actions decide growth.
Good conversion rates vary by funnel stage. Top-of-funnel (visitor → lead) averages around 2%. At the same time, high-performing SaaS teams can reach 8–15%. Mid-funnel stages like MQL → SQL usually convert 30–50%. Bottom-funnel stages like opportunity → customer often convert 30–40%.
First, measure your own funnel by stage. Then compare each stage against benchmark ranges for companies of similar size, industry, and channel. Focus on the stages where your conversions are below average.
Start with the stage that has the largest drop-off. Often, this is MQL → SQL or SQL → opportunity. Improving just one stage can significantly increase overall revenue.
Yes. SMBs often have higher top-of-funnel conversion rates but smaller deal sizes. Enterprise SaaS converts slower but deals are larger. Conversion expectations also vary by niche, such as marketing SaaS, HR SaaS, or cybersecurity SaaS.
Absolutely. Benchmarks shift with industry trends, seasonality, and macroeconomic conditions. That’s why tracking your funnel regularly and updating comparisons is essential.
Start using our A/B test platform now and unlock the hidden potential of your website traffic. Your success begins with giving users the personalized experiences they want.
Start Your Free Trial
Empowering businesses to optimize their conversion funnels with AI-driven insights and automation. Turn traffic into sales with our advanced attribution platform.

