Average cost per lead by industry ranges from below $100 in e-commerce and local services to nearly $1,000 in higher education.
Worldwide, the average cost per lead across industries is around $200. But this does not account for differences between B2B, B2C, and high-ticket sectors.
Higher education, legal services, financial services, and manufacturing consistently rank among the highest CPL industries.
E-commerce, HVAC, and other broad-market or local service have the lowest CPC, which is below $100.
SEO ($30), email marketing ($50), and webinars ($70) offer the lowest average cost per lead among B2B channels.
Businesses using AI for lead generation experience an almost 50% increase in sales-ready leads. They report up to 60% lower customer acquisition costs.
Companies that blog actively generate over 10x more leads than those that don’t. Content marketing yields 3x more leads at 62% lower cost over the standard advertising or direct mail.
Close to 90% of B2B marketers use LinkedIn.
Interactive content yields 2x more conversions and 5x more pageviews than static content.
We analyze both paid and organic channels to show how lead generation costs actually behave in real-world campaigns. You’ll see why:
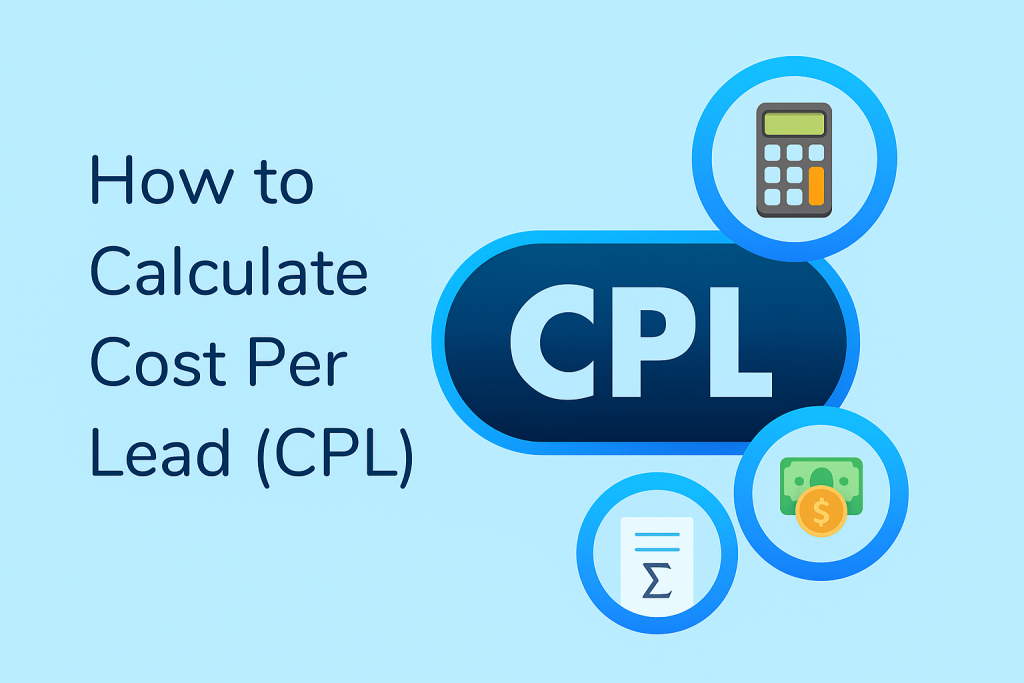
To understand what Cost per lead measures you will also have to know how much you spend to generate one potential customer. It works as a key metric that shows your marketing efficiency. Smart businesses track this number closely to control their marketing costs.
CPL Formula: Total Marketing Spend ÷ Number of Leads Generated = Cost Per Lead
Here’s an example. Your company spends $5,000 on marketing this month. You generate 100 leads from that spending. Your average cost per lead is $50 ($5,000 ÷ 100 = $50).
Cost per lead differs from customer acquisition cost (CAC). CPL measures the cost to get a lead. CAC measures the cost to get a paying customer. Not every lead becomes a customer, so CAC is usually higher.
Industry | Paid CPL | Organic CPL | Blended Average CPL | Typical Buyer Intent | Factors Affecting CPL |
Legal Services | $325 | $90 | $285 | Very high | High case value, intense paid search competition, strong local intent |
Healthcare & Medical | $290 | $80 | $250 | Very high | Regulatory compliance, patient trust, long decision cycles |
Financial Services | $275 | $70 | $230 | High | Heavy regulation, competitive keywords, high customer lifetime value |
Insurance | $190 | $45 | $155 | High | Policy complexity, aggressive bidding, repeat purchase potential |
Real Estate | $225 | $50 | $185 | Medium–High | Location-based competition, seasonal demand, high transaction value |
B2B Software / SaaS | $200 | $60 | $170 | High | Long sales cycles, niche targeting, demo-based conversions |
IT & Managed Services | $210 | $65 | $175 | High | Contract-based sales, high-value clients, trust-driven decisions |
Cybersecurity | $235 | $70 | $195 | Very high | High-risk solutions, enterprise buyers, limited qualified audience |
Manufacturing | $170 | $40 | $130 | Medium–High | Complex buying committees, technical evaluation, longer funnels |
Industrial Services | $180 | $45 | $140 | Medium–High | Project-based demand, regional targeting, relationship-driven sales |
Technology (General) | $160 | $50 | $120 | Medium | Market saturation, rapid innovation cycles, varied buyer intent |
Automotive | $150 | $35 | $110 | Medium | Local competition, inventory availability, seasonal buying behavior |
Construction | $140 | $40 | $100 | Medium | Project timelines, regional demand, referral-heavy conversions |
Architecture & Engineering | $165 | $45 | $125 | Medium–High | Specialized expertise, long proposal cycles, limited buyer pool |
Logistics & Supply Chain | $155 | $45 | $115 | Medium | B2B contracts, price sensitivity, operational complexity |
Education & Training | $130 | $30 | $90 | Medium | Budget constraints, enrollment cycles, trust and accreditation factors |
Staffing & Recruitment | $145 | $35 | $105 | Medium | High volume needs, fast turnaround, employer demand fluctuations |
Business Consulting | $185 | $55 | $150 | High | Expertise-based sales, long consideration phase, premium positioning |
Marketing Agencies | $160 | $50 | $120 | Medium | Crowded market, differentiation challenges, service commoditization |
Accounting & Tax Services | $170 | $45 | $135 | Medium–High | Seasonal demand, compliance needs, trust-based decisions |
E-commerce | $90 | $25 | $70 | Medium | High competition, low margins, high-volume lead generation |
Retail | $80 | $20 | $60 | Medium–Low | Price sensitivity, impulse purchases, strong organic traffic |
Consumer Electronics | $85 | $22 | $65 | Medium–Low | Product commoditization, rapid price comparison |
Home Services | $95 | $30 | $75 | Medium | Local SEO impact, urgency-based searches, service availability |
Fitness & Wellness | $85 | $25 | $65 | Medium–Low | Membership pricing, lifestyle-driven intent, local competition |
Beauty & Aesthetics | $110 | $35 | $85 | Medium | High visual appeal, local targeting, repeat customers |
Travel & Tourism | $60 | $15 | $40 | Low | Seasonal demand, discretionary spending, comparison-heavy buyers |
Hospitality | $65 | $18 | $45 | Low | Price-driven decisions, OTA competition, seasonal fluctuations |
Food & Beverage | $70 | $20 | $50 | Low | Impulse buying, low order value, strong brand loyalty |
Media & Entertainment | $75 | $22 | $55 | Low | Subscription fatigue, content saturation, low switching costs |
This table shows the average cost per lead (2025/2026) by marketing channel, based on the latest industry benchmarks.
Note: CPL varies by industry, audience targeting, funnel stage, and execution quality. These figures are directional benchmarks, not fixed prices.
Lead Generation Channel | Typical Cost Per Lead (2025–2026) | Notes / Quality Signals | Best Use Cases |
SEO / Organic Search | $30 – $90 | Often the lowest CPL over time; high-intent traffic | Long-term growth, inbound demand, cost-efficient lead generation |
Email Marketing | $50 – $100 | Strong CPL when lists are segmented and nurtured | Lead nurturing, upsells, reactivation campaigns |
Webinars / Virtual Events | $70 – $250 | High-intent leads; requires planning and promotion | B2B education, product demos, complex buying decisions |
Social Media Ads (Facebook/Instagram) | $50 – $150 | Flexible targeting; CPL varies by niche | B2C offers, mid-funnel demand, audience testing |
Google Search Ads (Paid SEM) | $70 – $350+ | Very high intent; competitive keywords | Capture bottom-funnel demand, urgent or high-value leads |
LinkedIn Ads | $150 – $450+ | Strong B2B targeting; higher CPC and CPL | B2B lead gen, decision-makers, account-based marketing |
Content Marketing (Blog / Whitepapers) | $40 – $200 (long term) | Lower blended CPL over time; quality improves with scale | Thought leadership, SEO-driven leads, long sales cycles |
Cold Outreach (Email / Phone) | $150 – $700+ | Highly targeted but resource-intensive | Enterprise sales, outbound B2B, niche audiences |
Events & Trade Shows | $200 – $811+ | Expensive but strong relationship-building | Enterprise deals, high-ticket services, partnerships |
Referrals / Partnerships | $0 – $50 | High trust and conversion rates | Scaling through networks, low-cost acquisition |
Affiliate Marketing | $50 – $100 | Performance-based; quality varies by partner | E-commerce, SaaS, scalable performance campaigns |
Retargeting / Remarketing | $30 – $120 | Lower CPL than cold traffic; intent already established | Converting warm audiences, reducing overall CPL |
✔ Lower CPL channels (SEO, referrals) typically require time and content investment but yield sustainable, compounding results.
✔ Paid channels (Google, LinkedIn) often cost more per lead. But they can drive faster results when optimized.
✔ Event-based channels cost the most but deliver high-quality, high-intent engagements.
✔ Costs shown are ranges, not absolutes. Your actual CPL will vary by industry, audience, and campaign structure.
Business Type & Size | Typical Average CPL (2025–2026) | Lead Quality & Notes |
Small B2C Businesses (annual revenue < $5M) | $30 – $120 | Often lower CPL due to simpler purchase decisions and localized audiences. |
Mid-Sized B2C Businesses ($5M–$50M) | $50 – $200 | CPL rises with broader targeting and multi-channel marketing. |
Large B2C Enterprises (> $50M) | $80 – $300 | Higher spend on paid media; greater focus on segmented audiences. |
Small B2B Firms (annual revenue < $10M) | $80 – $250 | B2B cost per lead is higher due to sales cycle complexity. |
Mid-Sized B2B Companies ($10M–$100M) | $130 – $380 | Lead generation pricing reflects deeper funnel nurturing, higher targeting costs. |
Large B2B Enterprises (> $100M) | $200 – $600+ | Highest CPL benchmarks; enterprise sales require personalized outreach & account-based strategies. |
Startups / Early Stage Companies (pre-funding or seed) | $40 – $180 | Focus often on rapid growth; CPL varies widely by channel mix. |
Growth Stage Companies (Series A–C) | $90 – $300 | Lead cost benchmarks rise with scaling paid acquisition efforts. |
Enterprise & Corporate Marketers | $180 – $650+ | Heavy investment in multi-touch campaigns and long nurture sequences. |
Franchise / Multi-Location Businesses | $70 – $240 | Variable CPLs based on local vs centralized marketing spend. |
E-Commerce Small Shops | $25 – $90 | Lower side of CPL due to high volume and transactional buyers. |
E-Commerce Mid / Large | $50 – $150 | CPL increases with competitive paid search & social spend. |
Professional Services Small Firm | $90 – $260 | Consultative services drive higher CPL due to qualification needs. |
Professional Services Large Firm | $150 – $420 | Enterprise consulting and legal services see some of the highest CPL benchmarks. |
High-Tech Startups | $100 – $320 | B2B SaaS sales cycles and lead complexity push CPL higher than typical B2C. |
These benchmarks help you compare your current performance against industry norms and set realistic expectations for lead generation budgeting in 2025.
IMPORTANT NOTE: Paid and organic CPL differences reflect lead source dynamics. Organic efforts often yield better quality, while paid channels give faster traffic and the data may differ from what was originally intended due to cost.
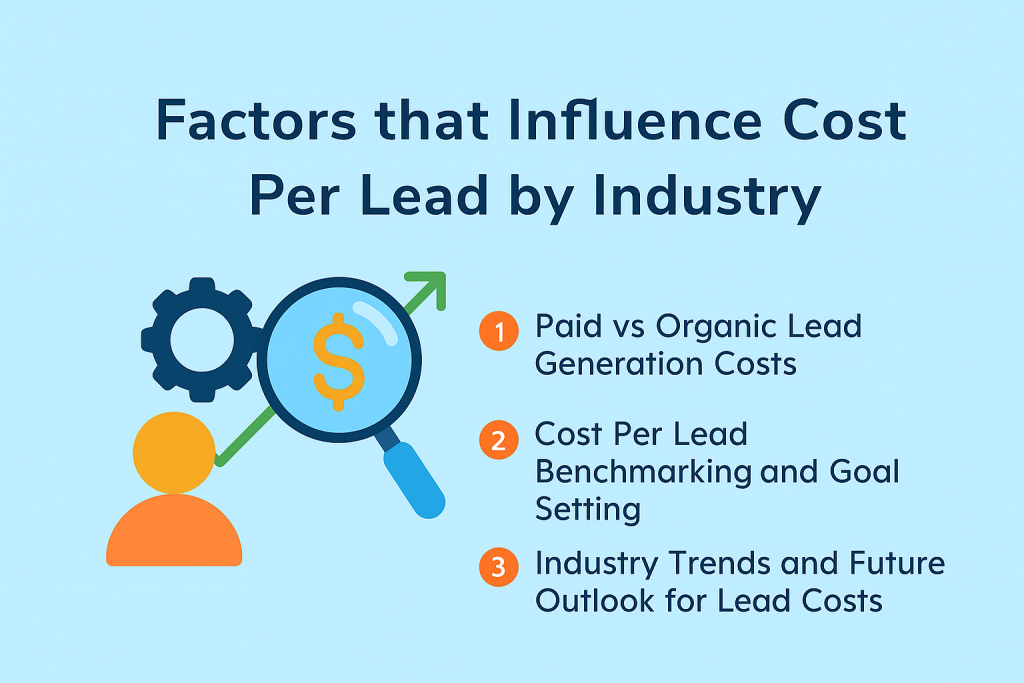
Market competition directly impacts lead costs across all industries. Saturated markets drive prices up through bidding wars. New markets offer opportunities for lower costs initially.
Sales cycle length affects how much companies invest per lead. Complex B2B sales justify higher upfront lead costs. Simple consumer purchases require cheaper lead generation approaches.
Target audience behavior shapes channel effectiveness and pricing. Professional audiences cost more to reach than general consumers. Specialized expertise commands premium lead prices consistently.
Different industries favor different marketing channels naturally. LinkedIn works for B2B while Instagram suits lifestyle brands. Channel costs vary dramatically between platforms and industries.
A lower CPL does not only save money. It often results in higher-quality leads. Below are practical strategies to reduce CPC across industries and channels.
Understanding exactly who your ideal customer is helps focus your marketing efforts. Segment audiences by:
When your campaigns reach the right people, fewer resources are wasted. It reduces the average cost per lead in your industry. Clear audience definition also improves engagement and conversion rates.
Beyond identifying your audience, adjust your campaigns to prioritize high-intent prospects. Use filters such as location, interests, device type, or previous engagement. Focusing on prospects most likely to convert ensures your lead generation cost is spent efficiently. Overly broad targeting often drives up CPL without meaningful results.
The relevance of your ad copy and visuals directly affects conversions. Ensure headlines, descriptions, and calls-to-action match the expectations of your audience. Consistent and clear messaging increases click-through and conversion rates. This lowers your CPL by industry. Regular A/B testing helps identify the most effective combinations.
Optimized landing pages are essential to convert clicks into leads. Ensure pages load quickly and are mobile-friendly. They should present a clear single call-to-action. Forms should be concise and easy to complete. High-performing landing pages increase conversions. This, in turn, reduces your cost per lead 2025/2026 by making each click more valuable.
Optimize Every Landing Page Now
For paid search campaigns, target keywords that indicate strong purchase intent. Avoid generic or overly broad keywords. They usually attract casual visitors. High-intent keywords improve lead quality and reduce wasted spend. It makes your lead cost benchmarks more efficient. A good way to spot strong purchase intent is to look for words that suggest action or urgency. These include location names, “near me,” “open now,” “book,” “appointment,” or “accepting new patients.”
See How We Eliminate Ad Waste Automatically
Negative keywords prevent your ads from showing to audiences unlikely to convert. For example, excluding searches like “free” or “cheap” ensures your ads reach serious buyers. This simple tactic reduces irrelevant clicks. It improves efficiency and lowers your average CPL for paid campaigns.
Not all visitors convert on their first interaction. Retargeting allows you to show ads to users who earlier engaged with your content. These prospects are already familiar with your brand. This often leads to higher conversion rates. It also makes way for more favorable lead generation cost comparison across channels.
When marketing and sales collaborate closely, campaigns target leads that truly match your ideal customer profile. Sharing insights on lead quality helps marketing focus on high-value prospects. This alignment reduces wasted effort and improves your industry lead cost efficiency. This happens because only qualified leads are pursued.
Automating lead management processes, such as follow-ups, email sequences, and lead qualification, increases efficiency. Lead scoring ranks prospects based on engagement, fit, and intent. Prioritizing high-value leads ensures resources are focused on leads most likely to convert. This is essential to lower B2B cost per lead and increase ROI.
Regularly monitor CPL benchmarks by industry to identify underperforming campaigns. Analyze which channels, audiences, and creatives deliver the best results. Quickly pause or optimize campaigns with high CPL. Continuous measurement ensures your average cost per lead remains competitive.
Track Cost Per Lead alongside Cost Per Acquisition to ensure the leads you generate convert into paying customers. Balancing CPL with lead quality prevents sacrificing results for lower numbers. It ensures optimal lead generation pricing.
Cost per lead by industry varies widely. B2B cost per lead is higher than local services. Finance and legal sit at the top. Ecommerce stays lower. But within the same industry, CPL by industry can still swing wildly based on strategy.
The good news is that most wasted spend is fixable.
Broad targeting looks safe. It is not.
When ads reach everyone, they attract anyone.
Refined targeting lowers average CPL because fewer clicks turn into more real leads. This works best when audiences reflect actual buyers, not assumptions.
Key checks help here:
Many teams discover that tighter targeting raises click cost but lowers lead generation cost overall. Fewer people click, but more convert. That trade is usually worth it.
A strong ad can still fail on a weak page. Landing pages often carry the biggest hidden cost.
A good page answers doubts fast. It does not show off. It guides.
Common decision moments include:
Simple changes lower cost per lead 2025/2026 figures quickly. Clear headlines. Fewer fields. Honest copy. Mobile speed. Each fix trims friction.
When pages improve, cost per lead statistics drop even without changing ads.
Paid leads cost more each year. Inbound leads age better.
Content attracts people who are already searching. Blogs, guides, videos, and case stories work quietly but steadily. They reduce dependency on ads and stabilize average cost per lead in the long run.
Inbound helps answer another real concern.
Do these leads even understand the offer?
When content educates first, sales spends less time explaining basics. That lowers cost per lead vs cost per acquisition gaps.
Ad platforms reward relevance. Poor ads pay a penalty.
Better relevance comes from:
Higher quality scores often reduce industry lead cost even when bids stay the same. This matters in crowded markets where CPL benchmarks by industry feel fixed but are not.
Ads that feel helpful win cheaper clicks. Ads that feel pushy pay more.
Automation saves time. AI saves mistakes when used well.
In 2026, AI supports:
This helps reduce cost per lead by stopping spend on low intent traffic early. It also improves lead cost benchmarks because sales teams focus on better prospects.
The key question stays simple.
Is this lead likely to talk back?
AI helps answer that faster than guesswork.
Small changes compound. Testing proves which ones matter.
A/B testing applies to:
Even a small lift in conversion rate reduces lead generation pricing across channels. This matters most when traffic costs are high.
Testing also removes opinion battles. Data decides. That clarity saves money.
Most visitors leave without converting. That is normal.
Retargeting brings them back when interest is warmer. This lowers average CPL because the second click costs less than the first decision.
Effective retargeting works best when:
It answers a familiar hesitation.
Do I really need this right now?
A calm reminder often works better than a loud pitch.
Misalignment wastes leads. Sales rejects them. Marketing keeps sending more.
Alignment starts with shared definitions. What is a good cost per lead? What quality matters? When should follow up happen?
When teams agree, cost per lead comparison improves across channels. Fewer leads fall through cracks. Conversion rates rise without extra spend.
This matters most in B2B, where average B2B lead cost by industry stays high and patience runs thin.
Use industry averages as starting points, not absolute targets. Your specific market position affects realistic cost expectations. Premium brands can justify higher lead costs naturally.
Set CPL goals based on customer lifetime value calculations. If customers generate $1,000 profit, $100 lead costs work. It is imperative to set arbitrary cost targets without considering the revenue context, and that is where tools like Customer Lifetime tools can help to see the bigger profit picture beyond just the CPL..
Monitor trends monthly and adjust strategies quarterly at minimum. Market conditions change rapidly in digital marketing environments. Stay flexible with budget allocations and channel focus.
Connect lead costs to broader business metrics always. Revenue per lead, conversion rates, and sales cycle length matter. Optimize the entire funnel, not just top-of-funnel costs.
Lead generation is no longer about volume alone. Privacy rules are tighter. Buyers are tired. Budgets are under pressure.
So the real question becomes simple. How much does a lead cost, and is that lead worth it?
The average cost per lead in 2025 already rose across many sectors. In 2026, the gap between good and poor strategy widens even more. Some teams lower their average CPL. Others see costs spike with little return.
The trends below explain why.
Third-party cookies are fading fast. Browsers block them by default. Users opt out more often.
This changes how lead generation cost is measured and controlled.
Without cookies, brands rely on:
At first, this feels risky. Tracking looks weaker. Retargeting feels harder.
But over time, cleaner data improves cost per lead statistics.
Why? Because leads come from real interest, not repeated chasing.
For industries like finance or healthcare, the average cost per lead by industry often stabilizes after the shift. Fewer leads arrive, but quality improves. That balance matters more than volume.
AI tools are everywhere in 2026. But smart use beats blind use.
AI now helps with:
This affects CPL benchmarks by industry in a big way.
Teams using AI only for volume often see higher lead generation pricing with no gain. Teams using it to filter and refine usually reduce waste.
A practical thinking moment helps here.
Is this lead likely to talk to sales, or just browsing?
AI answers that faster than manual checks. That speed lowers the average B2B lead cost over time, especially in SaaS, consulting, and IT services.
CTA: See how our AI Shopping Buddy can turn visitors into buyers
Intent-based marketing moves away from guesswork. It focuses on signals that show real buying interest.
Examples include:
This matters because industry lead cost rises when ads chase the wrong people.
Intent reduces that waste.
For example, the average cost per lead in software stays high when targeting broad audiences. When intent filters apply, fewer clicks turn into more qualified leads. CPL by industry becomes easier to predict.
The decision moment sounds familiar.
Is this worth the money, or just traffic noise?
Intent answers that before spend grows too large.
Buyers are skeptical in 2026. Glossy claims feel empty.
Real answers win trust.
Substance looks like:
This shift affects lead cost benchmarks more than expected.
When content helps users decide, fewer leads bounce later. Sales cycles shorten. Cost per lead vs cost per acquisition gaps shrink.
For B2B brands, this often lowers average CPL even if ad costs stay the same. The lead is better prepared. That preparation saves money later.
It also answers a quiet concern many teams have.
Do these leads even know what they want?
Substance ensures they do.
Video is no longer optional. Short videos explain faster than long pages.
In 2026, video leads the journey, not follows it.
Effective video use includes:
Video improves cost per lead by industry in uneven ways.
Ecommerce sees faster form fills. B2B sees fewer but stronger leads. Education and real estate see higher engagement time.
The key is clarity, not polish. A simple screen recording often beats a studio ad.
A common decision moment appears here.
Do people really watch this?
Understanding average cost per lead by industry helps you set realistic budgets and goals. Use our data as starting points while tracking your specific results. Focus on lead quality and customer lifetime value over simple cost reduction.
Start by calculating your current CPL across all channels. Compare against industry benchmarks and identify improvement opportunities.
For example, A/B Test Platforms help you identify which messages or designs convert best, while Ads Optimizers ensure your ad spend works harder. Test new channels and strategies based on successful competitors.
Monitoring trends regularly and incorporating smart practices which allows you to adapt to changing market conditions is important. The most successful companies balance cost efficiency with lead quality. Use these insights to optimize your marketing performance and grow revenue effectively.
Cost per lead pricing refers to the amount a business pays to acquire a single lead. It varies by industry, channel, and campaign. Effective lead generation pricing balances cost with lead quality.
How much you pay depends on your industry and customer value. High-value B2B leads usually cost more. Use CPL benchmarks by industry to set realistic expectations.
The average cost per lead in the auto industry ranges from $110 to $150 in 2025/2026. Costs vary by dealership, location, and marketing channel.
Average cost per click (CPC) differs by platform and industry. Paid search and social ads typically range from $1 to $5 per click for B2C. B2B campaigns can cost $3 to $15 per click. CPC affects overall lead generation cost in 2026.
Average cost per click (CPC) differs by platform and industry. Paid search and social ads typically range from $1 to $5 per click for B2C. B2B campaigns can cost $3 to $15 per click. CPC affects overall lead generation cost in 2026.
The 70/20/10 rule divides marketing budgets as follows:
It helps control lead generation cost while encouraging innovation.
Empowering businesses to optimize their conversion funnels with AI-driven insights and automation. Turn traffic into sales with our advanced attribution platform.
Trusted by Customers


©CausalFunnel Inc. All rights reserved.

")