
")


Free Funnel Audit
Convert more customers today!

PPC
6 mins read


PPC
6 mins read
Running PPC campaigns can quickly become expensive and confusing. Many marketers struggle to prove what’s really working and what’s wasting budget. Creating detailed reports from multiple ad platforms often takes hours every week.
A smart PPC report template solves this problem. It pulls your campaign data into one clear, easy-to-read view. You can instantly see which ads bring the best results and where improvements are needed.
This guide will show you how to build reports that track ROI, CTR, and conversions without effort. You’ll learn how structured PPC reporting can save time, impress clients, and make your marketing decisions faster and more confident.

A PPC report template is a structured document that shows how your ads perform across different campaigns. It combines data like ROI, CTR, conversions, and cost-per-click into one simple format. This template gives you a quick view of what’s working and what’s not.
Instead of building a new PPC report every time, a template helps you save effort and stay consistent. It turns complex ad results into clear insights that anyone can understand. Whether you’re sharing results with a client or your marketing team, it helps everyone stay on the same page.
Its main purpose is to make recurring reporting faster and easier. You can use it weekly, monthly, or after each campaign to compare performance trends. Over time, it helps you notice patterns and optimize future ad budgets.
What it helps marketers do:
A good template isn’t just about numbers. It connects those numbers to business goals, helping you understand how every click impacts growth.
Clients want to see proof that their advertising money is driving real results. Clear and consistent PPC reporting for clients helps build that trust. It shows exactly where every dollar goes and what return it delivers. Without an organized format, reports can feel confusing or incomplete, leading to misunderstandings and doubt.
A strong PPC report template solves this by keeping every report structured and transparent. Once created, the same format can be reused each month, saving you time while keeping your data presentation consistent. You simply update the numbers and insights, and the report is ready to share.
Good PPC reporting also supports better communication. It allows clients to focus on what matters most: growth, return on investment, and audience engagement. Instead of guessing which campaigns perform best, both sides can see results clearly.
Here’s why a template makes all the difference:
When your reports are easy to read, your clients feel confident in your expertise. A reliable reporting structure turns complex data into insights that strengthen long-term partnerships and demonstrate measurable value.
This clarity is especially important for ppc lead generation, where clients want to clearly see how ad spend translates into qualified leads and business growth.
Every PPC report template is built around a set of key performance indicators, or KPIs. These metrics help marketers and clients understand how well each campaign performs. Tracking them regularly reveals patterns, strengths, and problem areas before they become expensive mistakes.
Consistent tracking keeps your PPC report focused on results instead of random numbers. When you know what to measure, you can make better decisions about budget, targeting, and creative direction. These are considered the most important ppc metrics for evaluating real campaign performance. Here are the essential metrics your report should always include.
CTR is a metric that shows how many people clicked your ad right after seeing it. A high CTR means your message and offer are relevant. If CTR is high but conversions are low, review your landing page for friction or poor alignment.
Conversion rate tracks how many clicks turned into valuable actions, such as purchases or sign-ups. It helps measure how effectively your ad drives meaningful results. A steady rise in conversions signals healthy engagement and trust.
CPA shows how much you pay for each customer or lead. It helps determine if your spending matches your goals. A rising CPA often means you need to refine targeting or improve ad copy.
ROAS measures how much revenue you get to earn for every dollar you spend on ads. It’s the clearest sign of profitability. If ROAS drops, review your campaign mix and check for wasted spend.
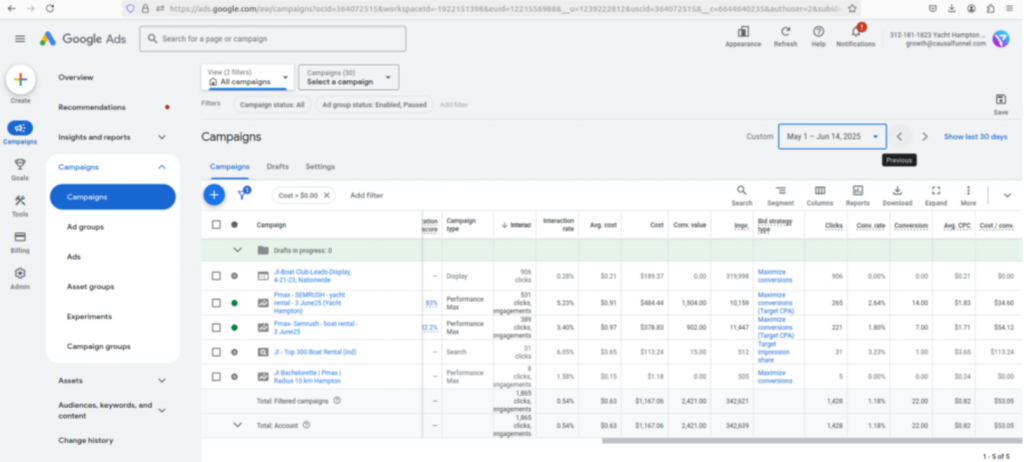
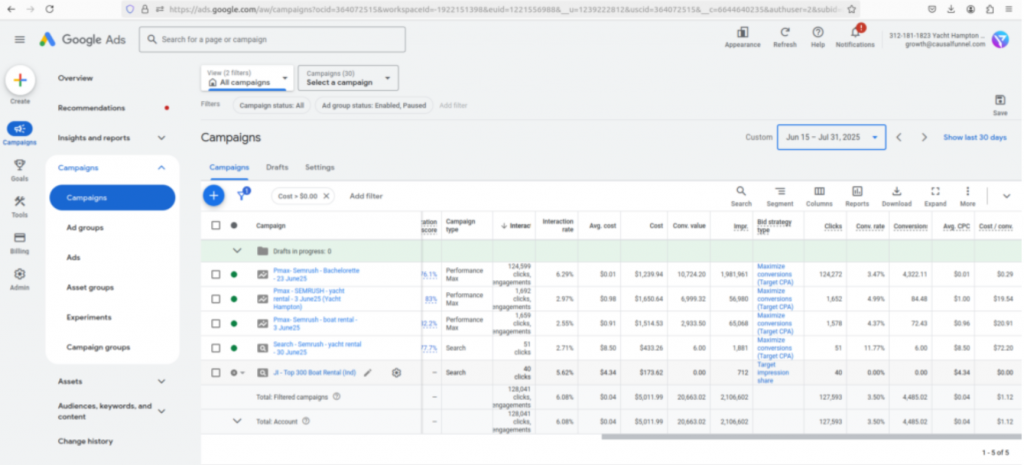
A higher ROAS is what every business wants and as a business, you should take the leap and invest in a reliable AI-powered ads optimizer. For instance, a high-end luxury charter company saw a 2x increase in ROAS just by optimizing Google Ads.
Before
After
These metrics show how many people saw and interacted with your ads. High impressions but low clicks can suggest weak ad relevance or poor visuals. Adjust your ad creative or keywords to attract more interest.
This Google Ads metric combines CTR, ad relevance, and landing page experience. A higher score lowers your cost-per-click and improves ad placement. If your Quality Score drops, revisit keyword alignment and ad copy clarity.
Tracking these metrics regularly keeps your reporting accurate and actionable. They help you understand not just how many people clicked, but why they acted or didn’t.
Every business runs campaigns on different platforms. Choosing the right PPC report template helps you measure what matters most on each channel. Each platform highlights unique data points, so your report format should reflect that. Here are the main types of templates you can use.
This template focuses on key Google Ads metrics like CPC, impressions, conversions, and Quality Score. It helps you track how your keywords and ad groups perform over time. If your impressions are high but CTR is low, you may need to refine your ad text or targeting.
Ideal for social campaigns, this format highlights engagement rate, reach, and cost per lead. It shows which ad creatives or audiences deliver the best results. You can quickly compare performance across demographics and placements to see what drives conversions.
Designed for B2B marketers, this template tracks metrics like clicks, leads, and cost per conversion. It’s perfect for showcasing thought-leadership campaigns or lead-generation performance to business clients.
This option combines data from multiple platforms, including Google, Facebook, and LinkedIn. It gives a complete picture of your digital ad performance in one view. Agencies often use it to show clients how each channel contributes to overall ROI.
This version summarizes long-term performance trends. It’s built for executives who need a high-level snapshot of spend, ROI, and conversions each month. It can also highlight which campaigns deserve more budget or attention next cycle.
Choosing the right format depends on your data sources and goals. Smaller teams might prefer simple spreadsheet templates. Larger agencies often rely on automated PPC reporting dashboards for faster updates and cleaner presentations. In any case, a professional PPC agency can help you get the right template and even track metrics to show you growth.
Start with clear business outcomes before picking metrics. Decide if success means leads, sales, or meaningful engagement. Match each goal to a simple, trackable KPI. Keep scope focused to avoid data noise. Write the goal at the top. Refer to it during every review.
List where your numbers will come from each period. Use Google Ads, Facebook Ads, and GA4 together. Map each source to the same date range. Align campaign names to avoid duplicate entries. Document access steps for teammates. Protect logins with shared credentials tools.
Choose a small set you will track always. Use CTR, CPA, ROAS, and conversions by default. Add impressions and clicks for volume context. Keep formulas consistent across months. Define each metric in a notes tab. Lock the cells that contain formulas.
Show trends with simple line and bar charts. Add a spend versus ROI view for quick insight. Break charts by channel or campaign where useful. Limit colors and legends to aid scanning. Place key charts near the summary section. Keep tables short and sortable.
Add plain-language notes beneath every main chart. Explain what changed and why it matters. Tie insights back to the original goal. List one to three next steps only. Use dates and owners for each action. This turns reporting into real improvement.
Connect sheets or dashboards to live sources. Use Looker Studio or Swydo for scheduled refreshes. Standardize naming so connectors match fields. Set automatic delivery for stakeholders. Share a read-only link for easy access. Keep a manual export backup monthly.
Compare results against prior periods and targets. Adjust targets as markets and costs shift. Remove unused widgets to reduce clutter. Archive old tabs instead of deleting them. Your PPC report template will stay fast and relevant. Great PPC reporting improves with steady iteration.
Manual reports take time and can lead to errors. Automated PPC reporting makes the process faster, cleaner, and far more reliable. It lets you focus on improving campaigns instead of collecting data every week.
Automation connects your ad platforms directly to your reporting dashboard. Once set up, the data flows in real time, keeping every number up to date. You can create a single view that shows performance across Google Ads, Facebook Ads, and other platforms. This saves effort and reduces mistakes caused by manual copy-pasting.
Using tools like Google Ads Report Editor, Looker Studio, or Swydo, you can schedule recurring updates and automate delivery. This is especially useful for PPC reporting for clients, where consistency and accuracy matter most.
A reliable ppc reporting tool helps centralize this automation, ensuring data stays accurate while reports remain easy to manage and scale.
Automation gives you control over data quality and presentation while cutting down hours of repetitive work. It ensures every stakeholder sees current results without waiting for manual exports.
What automation helps you achieve:
Automation doesn’t just make reports easier, it builds trust. When clients see live, accurate dashboards, they know you value transparency. Automated reports also free you to analyze insights and make faster, smarter marketing decisions.
Even the best marketers make errors when building reports. Understanding these mistakes helps you create cleaner and more effective insights. A clear PPC report should always guide decisions, not confuse them. Here are common pitfalls to avoid.
Every client or business has unique goals. Don’t track metrics that don’t align with those goals. Focus on the numbers that directly support campaign success, like conversions or ROI.
Numbers alone don’t tell the full story. Always include context around spend and returns. A high CTR means little if ROI is negative. Add commentary that connects ad performance to profit.
More data doesn’t always mean more insight. Keep your PPC reporting simple and easy to read. Highlight key takeaways rather than overwhelming readers with endless charts.
Manual updates waste time and increase errors. Use automation tools to refresh data and send reports automatically. This keeps reports current and accurate.
A report that stops at clicks misses the real value. Show how campaigns support lead quality, revenue, or lifetime customer value.
Avoiding these mistakes ensures your reports stay meaningful, focused, and client-friendly.
A well-organized PPC report template helps readers understand results quickly. Every section should guide the viewer from summary data to deeper insights without confusion. The goal is to tell a story covering everything from what you spent to what you earned.
Reviewing real ppc examples makes it easier to understand how report sections work together and how data should be presented for quick decision-making.
Start with basic details like campaign name, client, reporting period, and goals. Include a short overview of what success looks like. This sets context before diving into data.
Show your core metrics first. Use charts to display ROI, CTR, CPA, and conversions. Keep visuals simple and color-coded for clarity. Line graphs work well for trends, while pie charts highlight channel share.
Break results into smaller views. Show top-performing channels, keywords, ads, or devices. Include both winners and underperformers. This makes it easy to see where to adjust strategy.
Use a short paragraph or bullet list to summarize what worked and what needs fixing. Mention clear next steps, such as shifting budget or testing new ad creatives.
If possible, include a downloadable example or visual preview. A report layout that blends data, visuals, and commentary helps decision-makers see the full picture and act with confidence.
Sharing reports is more than showing numbers. Great PPC reporting for clients turns data into a clear story about performance and value. When clients understand results easily, they trust your process and feel confident about future spending.
A good presentation starts with structure. Focus on what matters most to each client. An executive wants to see ROI and conversions. A marketing manager might care more about click-through rates or campaign tests. Tailor your explanation to their goals.
To identify high-performing ads, use an automated A/B testing platform. A reliable platform should have a simple dashboard helping you track results of different versions: be it ad copy, landing page, CTA placement on your webpage, or anything else!
Use visuals that make information simple to grasp. Charts and trend lines show results better than dense tables. Add brief notes explaining what changed and why it matters. Your job is to guide clients through the data, not drown them in it.
Here are three quick tips to make every meeting count:
Clear, confident communication builds trust. Great PPC reporting isn’t about showing every number, it’s about helping clients see progress and opportunities that drive better decisions.
You can create a PPC report template with the following features to track your ad performance easily:
These features include everything you need to start effective PPC reporting right away. Once you create it, simply plug in your data and share the results with your team or clients.
A strong PPC report template does more than track numbers. It helps you see patterns, spot wasted spend, and understand which ads truly deliver ROI. With clear metrics and visuals, reporting becomes a tool for growth instead of a monthly chore.
Automating your PPC reporting saves hours and keeps your data accurate. It also gives you more time to focus on creative testing and strategy improvements. Consistent, well-structured reports build confidence with clients and help your team make smarter decisions.
Start refining your process today. Use this PPC report template to monitor ROI, CTR, and conversions in minutes. The right report turns raw data into clear insights and clear insights drive stronger, faster marketing results.
Start using our A/B test platform now and unlock the hidden potential of your website traffic. Your success begins with giving users the personalized experiences they want.
Start Your Free Trial
Empowering businesses to optimize their conversion funnels with AI-driven insights and automation. Turn traffic into sales with our advanced attribution platform.
Trusted by Customers


©CausalFunnel Inc. All rights reserved.