
")


Free Funnel Audit
Convert more customers today!
SEO
10 mins read

SEO
10 mins read
Most advertisers obsess over CPC and ROAS. But there’s one metric that quietly determines whether your ads live or die.If you run ads on Facebook, at some point you must have wondered:
“What is a good CTR for Facebook Ads?”
CTR stands for Click‑Through Rate. It shows how often people click your ad after seeing it.
CTR matters a lot. A higher CTR usually means your ads are relevant and compelling. And relevance helps with your ROI, cost‑efficiency, and ad optimization.
In this post, we will talk about:
CTR, or Click‑Through Rate, is a basic but powerful metric. It tells you how often people click your ad after seeing it.
The formula is simple:
CTR = (Clicks ÷ Impressions) × 100
For example:
CTR is like a pulse check for your ad. It shows whether your message and creatives are grabbing attention. Higher CTR usually means your ad is relevant, engaging, and aligned with your audience.
Facebook Ads Manager doesn’t just show one CTR. You’ll see different types, and each tells a slightly different story about engagement. Misreading these can lead to wrong conclusions about performance.
Let’s break them down with examples.
What it is:
Link Click CTR counts clicks that take people off Facebook to your website, landing page, or app.
Why it matters:
Example:
You run an ad for a new online course. Out of 1,000 impressions, 30 people click the link to your course page.
What it is:
Outbound CTR is very similar to Link Click CTR, but it specifically tracks clicks that take users to an external website, not internal Facebook pages.
Why it matters:
Example:
You have an e‑commerce ad. People click “Shop Now” and leave Facebook.
What it is:
Total Clicks CTR counts every click on your ad:
Why it matters:
Example:
A video ad gets:
If you only cared about website traffic, the 5% would be misleading. Your Link CTR was actually just 1%.
CTR Type | What It Counts | Best Used For | Common Mistake |
Link Click CTR | Clicks that take users off Facebook | Traffic, conversions, sales, lead generation | Confusing with total clicks, overestimating traffic |
Outbound CTR | Clicks to external websites only | Website traffic from ads, retargeting campaigns | Ignoring internal clicks, thinking every click counts |
Total Clicks CTR | All clicks (likes, shares, comments, link clicks, expansions) | Measuring engagement & content interaction | Using this as a traffic metric, inflating success |
CTR is important because:
Here’s what the latest data tells us:
Average CTR for Facebook ads across all industries in 2026 is around 1.4%–1.7%. That’s for link CTR.
This means:
Year | Average CTR (All Industries) |
2024 | ~1.5% |
2025 | ~1.71% (traffic campaigns) |
2026 | ~1.4%–1.7% (ongoing trend) |
Notice that average CTR slightly dropped in 2026 projected data compared to 2025. This is due to evolving algorithms and more competition for attention.
Here are some major influences:
Mobile ads tend to get higher CTR than desktop, because people tap screens impulsively.
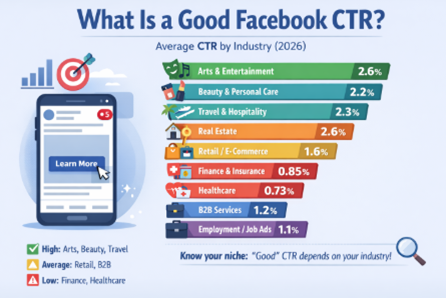
.Here’s a detailed benchmark table for 2026, with explanations for why CTR differs by sector:
Industry | Average CTR | Why It Performs This Way |
Arts & Entertainment | ~2.6% | High CTR because visual content is native to Facebook. Users are naturally drawn to events, music, and media. |
Real Estate | ~2.6% | Eye-catching listings and photos drive clicks. People are often ready to explore properties online. |
Travel & Hospitality | ~2.29% | Stunning visuals of destinations boost engagement. Users love exploring trips on mobile. |
Food & Restaurants | ~2.19% | People respond to mouth-watering images and special deals. Easy offer to act on. |
Apparel & Footwear | ~2.06% | Fashion visuals and seasonal promotions drive interest. Users can picture themselves with the product. |
Retail (General) | ~1.59% | CTR depends on discounts or product relevance. Broad campaigns can lower engagement. |
Legal Services | ~1.61% | CTR is moderate because offers are complex and users research carefully before acting. |
Health & Fitness | ~1.61% | People click for tips, workouts, and promotions. Trust in the brand matters. |
Consulting & Professional Services | ~1.37% | High-consideration services lower impulsive clicks. Ads need to educate before selling. |
Education | ~1.29% | CTR is lower because sign-ups are often high commitment and research-heavy. |
SaaS & Technology | ~1.04% | Offers are complex; users need time to evaluate, so CTR is naturally lower. |
Finance & Insurance | ~0.85% | CTR is low due to trust issues and complex offers. Users click carefully. |
Healthcare | ~0.73% | Sensitive and regulated content limits click appeal. High research barrier for users. |
Dental Services | ~0.88% | Offers are often local and trust-dependent, limiting broad engagement. |
Automotive / Auto | ~1.3% | Vehicle ads are highly visual but expensive and commitment-heavy. CTR is moderate. |
B2B Services | ~1.2% | Complex decision-making slows clicks. Content must educate before conversion. |
Beauty & Personal Care | ~2.2% | Strong visuals and influencer-style content increase CTR. Promotions work well. |
Home Improvement | ~1.5% | Niche and sometimes expensive offers lower impulsive clicks. Photos of results help. |
Employment / Job Ads | ~1.1% | CTR depends on relevance to user skills and location. High competition lowers rates. |
Pro Tip
“Good CTR” is always relative to your industry. If your CTR beats the average for your sector, you’re doing well.
Context matters more than the raw number. Knowing why your sector performs the way it does can help you set realistic CTR goals and optimize campaigns smarter.
A good CTR typically means you are in the top half of industry averages or above these figures.
For example:
“Good CTR” always depends on context: placement, ad objective, and creative quality.
Different campaign objectives have very different Click‑Through Rates (CTR). This is one of the most useful insights you can use when judging how well your ad is performing.
CTR isn’t just one number anymore. It changes a lot based on what you are trying to achieve with your campaign.
For example, a Lead Generation campaign often gets more clicks than a Reach campaign. This is because people who see lead ads are already interested in filling a form. On the other hand, Reach campaigns are meant to show your ad to as many people as possible, not get clicks. So, their average CTR tends to sit much lower.
Here’s a clear table of common objectives and their average CTRs from the latest cross‑industry data:
Campaign Objective | Typical CTR (Link) | What This Means |
Lead Generation | ~2.53% – 2.59% | People see value in signing up or learning more, so clicks tend to be high. |
Traffic / Link Clicks | ~1.57% – 1.71% | This objective optimizes for clicks to your site. It’s solid but usually lower than lead ads. |
Conversions / Sales | ~1.38% | Ads focused on purchases or signups see fewer clicks but more valuable clicks. |
Engagement | ~1.42% | People interact with post content, like, comment, or click. Mid‑range CTR. |
Video Views / Brand Awareness | ~1.21% – 0.94% | These goals push video plays or eyeballs on the ad, not clicks. So CTR skews lower. |
Reach | ~0.87% | Designed to show your ad to as many people as possible. Clicks are a bonus, not the main goal. |
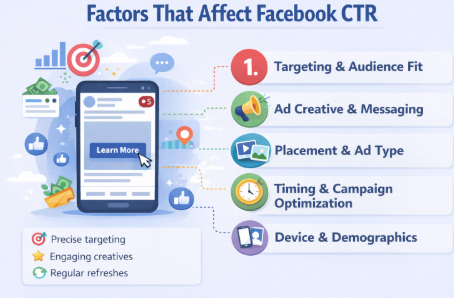
Let’s look at what can push your CTR up or down.
The better you segment audiences, the more relevant the ad feels.
Examples:
Your ad’s creative and messaging are the biggest drivers of CTR. Good visuals, strong hooks, and smart copy can make a huge difference in click‑through performance.
Different types of creative perform very differently on Facebook. Let’s look at how:
Creative Type | Typical CTR Range | Why This Happens |
Reels / Vertical Video | ~1.5% – 2.5% | Full‑screen mobile experience grabs attention fast. Vertical videos feel “immersive.” |
Feed Video (Horizontal / Square) | ~0.8% – 1.2% | Videos tell a quick story and hold eyes longer than static. |
Carousel Ads | ~1.4% – 1.8% | Users swipe through cards — more engagement options. |
Single Static Image | ~1.0% – 1.6% | Simple and effective, especially for retargeting and product shots. |
Basic Image (older averages) | 0.5% – 0.6% | Static images are less interactive by nature. |
Bottom line
Video tends to get more attention, but carousels often outperform simple images when done right. Reels lead because they take over the whole screen and keep users watching.
Headlines matter a lot. Some proven formulas:
These simple structures help because they show value fast.
Here are real‑style ad text examples that often lift CTR:
Product launch (image or video):
“New Arrival! Limited Pieces Left: Tap to Shop Before They’re Gone.”
Lead magnet (carousel or video)
“Download Our FREE Checklist: Boost Conversions by 30% in 30 Days.”
Service (vertical reel)
“How We Helped 500+ Businesses Double Revenue: Watch This Story.”
These are friendly, explicit about value, and tell people why to click.
The first 3 seconds matter, especially in video and Reels. Try these frameworks:
Shock & Curiosity
“90% of ads fail. Here’s what the top 10% do differently.”
Before → After:
“Struggling with sales? Watch how we turned it around in 10 days.”
Start With a Fact:
“Did you know carousel ads can out‑click static images by up to 24%?” (based on A/B tests)
Here’s what recent performance data tells us about formats:
Video wins attention
In testing across campaigns, video ads drove higher CTR and lower cost per click than static images roughly 60% of the time. In one split test, a 15‑second video had ~2.25% CTR vs 1.70% on an image.
Carousel can outperform video
In the same testing, a carousel ad with multiple static images scored higher CTR and lower cost per landing page view than a long video.
Static image ads are simple but solid
They work well when your message is very clear, your audience already knows you, or your offer is visual and immediate.
This all means: test all formats. Don’t assume one will always lead. Even static can beat video in some cases.
Here are some practical writing tips you can use:
✔ Is your headline benefit‑driven?
✔ Does the visual match the copy?
✔ Are you testing more than one format?
✔ Does the hook grab attention in the first seconds?
✔ Are you clear about what you want the user to do?
Different formats perform differently:
How often you refresh ads and optimize matters:
Mobile users tend to click more often.
Mobile CTR > Desktop CTR by ~30%+ in social ads.
Metric | Meaning | Use Case |
Link CTR | People who click to your site | Best for traffic goals |
Total CTR | All clicks (likes, shares, expands included) | Good for overall engagement |
If your goal is website visits, always focus on Link CTR.
✔ Google Analytics
✔ Meta’s Analytics and Insights
✔ UTM tracking (for deep attribution)
Here’s what many strong ads do right:
Ex: “Shop styles under ₹999 – Tap to see deals!”
Test:
Small wins in CTR lead to big gains over time.
Try:
Users who are already engaged with you are more likely to click again.
What is a bad CTR?
A CTR below your industry average is usually poor. Below ~1% for most industries may need improvement.
Does high CTR always mean success?
Not always. If clicks don’t convert to sales or leads, the value is limited.
How often should I test ads?
At least every 1–2 weeks or when performance drops.
Does CTR affect costs?
Yes. Facebook rewards higher relevance and CTR with lower CPC and better delivery.
✔ CTR helps measure ad relevance.
✔ Good CTR varies by industry.
✔ Overall 2026 CTR is ~1.4%–1.7%.
✔ Above average CTR in your niche = success.
✔ Creative, targeting, and optimization matter most.
CTR isn’t an isolated number. It’s a compass that guides improvement, efficiency, and ROI.
Website traffic refers to the number of people who visit your site. It shows how often your website gets visitors. High traffic usually means more leads and sales opportunities.
You enter a domain or URL into the tool. Then it shows estimated monthly visitors and trends. It breaks down traffic into organic and paid sources.
Organic traffic comes from search results you did not pay for. Paid traffic comes from ads you run. Organic traffic grows with better SEO; paid traffic grows with ads.
The estimates use AI algorithms and keyword data. They combine keyword rankings and click‑through rates. No tool can be as exact as your internal analytics, but estimates are reliable.
Start using our A/B test platform now and unlock the hidden potential of your website traffic. Your success begins with giving users the personalized experiences they want.
Start Your Free Trial
Empowering businesses to optimize their conversion funnels with AI-driven insights and automation. Turn traffic into sales with our advanced attribution platform.
Trusted by Customers


©CausalFunnel Inc. All rights reserved.