
")


Free Funnel Audit
Convert more customers today!

SEO
10 mins read

SEO
10 mins read
Cart abandonment costs Shopify stores billions in lost revenue every year. Shoppers add products to their cart, then leave without completing the purchase. The reasons vary: unexpected shipping costs, lack of urgency, better deals elsewhere, or simple hesitation at the final moment.
Cart and Discount testing gives you a systematic way to reduce abandonment by experimenting with incentives, thresholds, and messaging that push hesitant shoppers toward checkout. The CausalFunnel Shopify A/B testing app makes this process straightforward with a dedicated test type designed specifically for cart-level experiments.
This guide walks through the complete setup process, from defining your test hypothesis to launching the experiment and interpreting results. Every step mirrors what you see inside the CausalFunnel dashboard, so you can follow along as you configure your first cart test.
Not every conversion problem requires a cart test. Use this test type when your data shows specific cart-level friction that incentives or messaging can solve.
Use Cart and Discount tests for:
Use Element tests for:
Use Pricing tests for:
Cart tests specifically target the decision-making moment when a shopper has already shown intent by adding items but hasn’t committed to purchase.
Before diving into setup, understand how Cart and Discount tests work inside your Shopify store.
When you launch a cart test with a 50/50 split:
Control group (50%) – Sees your standard cart experience with no changes. No discount message, no threshold incentive, regular checkout flow.
Variant group (50%) – Sees the discount message and receives the incentive when they meet your trigger condition (cart value or quantity).
The split happens at the visitor level, not the session level. Once assigned to a group, that visitor remains in the same group throughout the test duration.
Cart tests use triggers to determine when the discount activates.
Cart value trigger – The discount becomes available when the cart subtotal reaches your specified amount.
Example: Set minimum cart value at $100. When a shopper’s cart reaches $100, they see the discount message and receive the incentive at checkout.
Use cases:
Cart quantity trigger – The discount activates when the cart contains your specified number of items.
Example: Set minimum quantity at 3. When a shopper adds 3 items, they qualify for the discount.
Use cases:
Percentage discount – Calculates the discount as a percentage of the cart total. A 10% discount on a $120 cart saves the customer $12.
Benefits: Scales with cart value, encourages larger purchases, easy for customers to understand.
Fixed amount discount – Deducts a specific dollar value from the cart total. A $15 discount applies the same savings regardless of cart size.
Benefits: Simple to communicate, predictable cost to you, works well for low-margin products.
Cart drawer – The discount message appears in the slide-out cart panel that opens when customers add items. This keeps shoppers on the current page and creates immediate awareness of the incentive.
Benefits: High visibility, non-intrusive, maintains shopping momentum.
Cart page – The message displays on the dedicated cart page (/cart). Shoppers see it when they click “View Cart” or navigate directly to cart.
Benefits: Larger space for detailed messaging, fewer distractions, more room for value reinforcement.
Choose placement based on where your customers typically review their cart before checkout.
Every effective cart test starts with a clear hypothesis based on observed behavior, not random guessing. Before opening the CausalFunnel app, answer these questions:
What problem are you solving?
Example: “60% of shoppers who add to cart abandon before checkout. Exit surveys suggest shipping costs are the primary barrier.”
What change do you believe will improve the outcome?
Example: “Offering free shipping at $75+ will reduce cart abandonment because it eliminates the shipping cost objection.”
What metric matters most?
Example: “Cart-to-checkout rate (primary) and revenue per visitor (secondary).”
What segment should see this test?
Example: “All traffic initially, but if successful, we’ll run a follow-up test targeting mobile-only since mobile abandonment is higher.”
Hypothesis 1: Free Shipping Threshold
Problem: Cart abandonment rate is 65%. Average cart value is $85, but shipping adds $12.
Hypothesis: Offering free shipping at $75+ will reduce abandonment by 15% because customers will perceive higher value and add items to reach the threshold.
Test configuration:
Hypothesis 2: Percentage Discount for Higher AOV
Problem: Average order value is $60, but profitable unit economics require $90+.
Hypothesis: Offering 10% off at $100+ will increase AOV by 25% because price-conscious shoppers will add items to reach the threshold.
Test configuration:
Hypothesis 3: Urgency Prompt for Hesitant Shoppers
Problem: Time in cart averages 8 minutes before abandonment, suggesting hesitation rather than price objection.
Hypothesis: Adding a time-limited 5% discount message will increase conversion by 10% because it creates urgency and reduces decision paralysis.
Test configuration:
Hypothesis 4: Quantity Discount for Bundle Sales
Problem: 80% of orders contain only 1 item. Product margins support multi-item purchases.
Hypothesis: Offering 15% off when customers buy 3+ items will increase multi-item orders by 30% because customers will perceive higher value in bundles.
Test configuration:
With your hypothesis defined, you’re ready to configure the test.
Log in to your Shopify admin, navigate to Apps, and open CausalFunnel A/B Test.
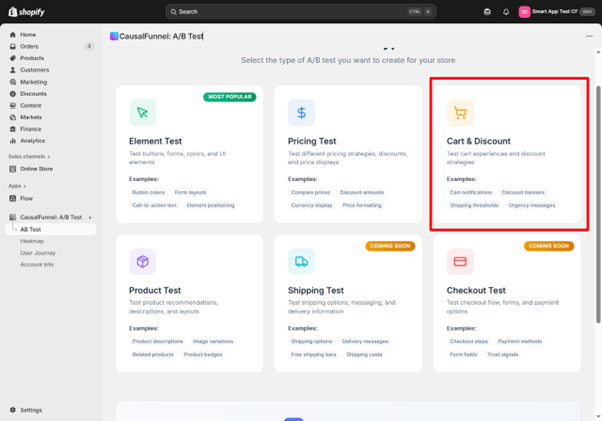
From the main dashboard, click Launch A/B Test or Create Test.
You’ll see test type options:
Click Cart and Discount Test to begin configuration.
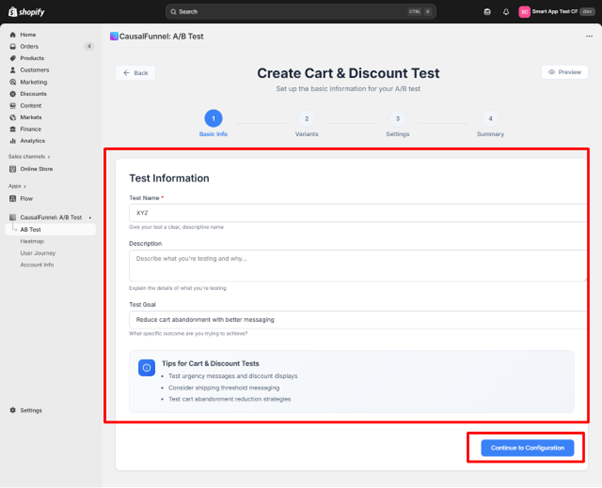
The first screen captures the core details that define your experiment’s purpose.
Enter a descriptive name that identifies this experiment at a glance.
Good examples:
Poor examples:
You’ll thank yourself later when you have multiple tests running and need to quickly identify each one on the dashboard.
Use this space to document:
Example description:
“Testing free shipping at $75 threshold vs control. The current abandonment rate is 65% with an average cart value of $85. Exit surveys show shipping cost as the primary objection. Hypothesis: Free shipping will reduce abandonment by 15% and potentially increase AOV as shoppers add items to reach a threshold.”
This description helps team members understand the test without additional explanation and serves as documentation when reviewing results weeks or months later.
Define the specific outcome you want to improve.
Common cart test goals:
Be specific. “Improve conversion” is vague. “Increase cart-to-checkout rate from 35% to 45%” is actionable and measurable.
The CausalFunnel interface highlights helpful reminders:
Urgency prompts often influence quick decisions – Time-limited offers or scarcity messaging can push hesitant shoppers toward completion.
Small cart messages can support higher engagement – Brief, benefit-focused copy performs better than lengthy explanations.
Well-placed discounts can restore intent – Strategic incentives at the right threshold can recover shoppers who were about to abandon.
These aren’t rigid rules, but they guide effective cart messaging.
After completing these fields, click Continue to Configuration.
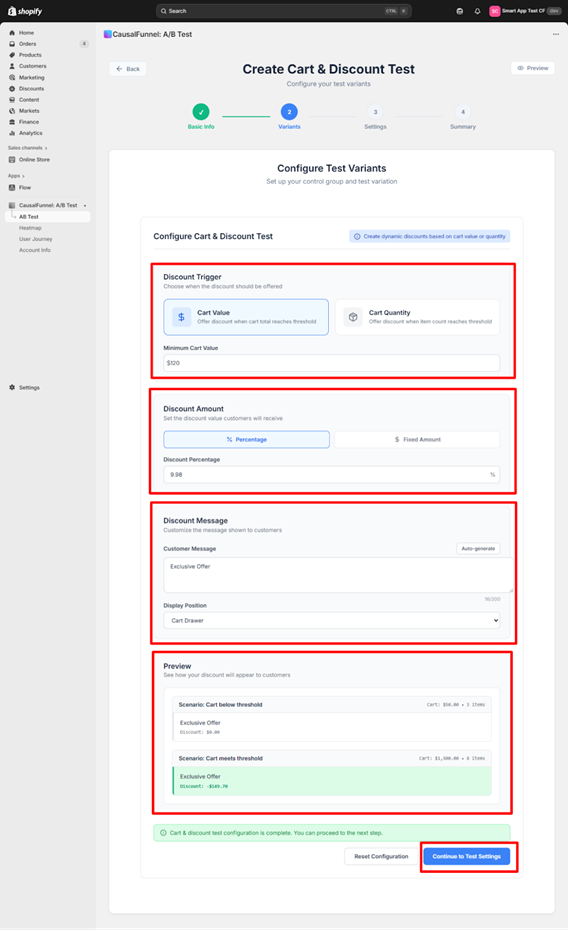
This screen defines the mechanics of your cart test: when the discount activates, how much customers receive, and what message they see.
Two trigger options appear. Select the one that matches your hypothesis.
Select this when your discount should activate based on cart subtotal amount.
When to use:
After selecting Cart Value, enter the minimum cart value threshold.
Example: Enter 75 if the discount should activate when the cart reaches $75 or more.
Trigger behavior:
Select this when your discount should activate based on the number of items in the cart.
When to use:
After selecting Cart Quantity, enter the minimum quantity threshold.
Example: Enter 3 if the discount should activate when the cart contains 3 or more items.
Trigger behavior:
Two discount types are available. Choose based on your economics and messaging strategy.
The discount is calculated as a percentage of the cart total.
When to use:
After selecting Percentage, enter the discount value.
Example: Enter 10 for a 10% discount.
How it works:
The dollar savings increase with cart value, incentivizing larger purchases.
A specific dollar value is deducted from the cart total regardless of size.
When to use:
After selecting Fixed Amount, enter the dollar value.
Example: Enter 15 for a $15 discount.
How it works:
The dollar savings stay constant, but the percentage decreases as cart value increases.
This is the text shoppers see in their cart. The message must be clear, benefit-focused, and action-oriented.
Message Components:
Status messages – Tell customers where they stand relative to the threshold.
Examples:
Reward messages – Confirm when they’ve qualified.
Examples:
Urgency elements – Create motivation to act now.
Examples:
You can write the message manually or click Auto-Generate to let the tool create one based on your trigger and discount settings.
Manual writing tips:
Keep it under 15 words for maximum clarity and impact. Use benefit language (“You’re saving”) rather than feature language (“Discount applied”). Include specific numbers to increase credibility.
Testing copy variations:
If you’re unsure which message performs better, run this cart test first with one message, then run a follow-up test with the winning configuration but different copy. This isolates the impact of messaging.
Select where the discount message appears in your store.
The message displays in the slide-out cart panel that appears when customers add items.
Benefits:
Ideal for:
The message displays on the dedicated /cart page.
Benefits:
Ideal for:
Check your analytics to see which cart view gets more traffic, then test in that location first.
The right panel shows two live scenarios that update as you configure settings:
Below threshold scenario – Shows what customers see when they haven’t met the trigger requirement. If your threshold is $75 and the preview cart shows $60, you’ll see the “Add $15 more” type message.
Threshold met scenario – Shows what customers see when they qualify for the discount. The preview cart meets your trigger amount and displays the reward message.
As you type the customer message and adjust discount values, both previews update instantly. Use this to confirm:
Make adjustments until both scenarios look correct, then click Continue to Test Settings.
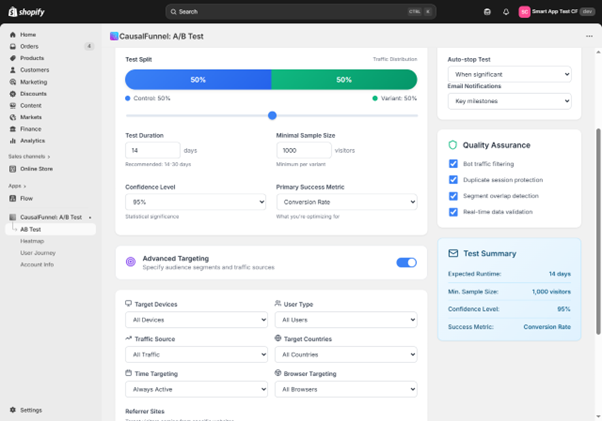
This screen controls how the test runs: traffic distribution, duration, sample size, and audience targeting.
Choose how to divide visitors between control and variant.
Default: 50/50 split
This balanced split produces the cleanest comparison because both groups experience identical traffic conditions.
When to adjust the split:
70/30 or 80/20 splits – Use when you’re confident the variant won’t hurt conversion and want to expose more traffic to the potential winner. This is common for follow-up tests when you’re refining a proven concept.
20/80 or 30/70 splits – Use when testing aggressive discounts that could hurt margin. Limit exposure to the risky variant while still collecting valid data.
For your first cart test, keep the default 50/50 split.
Set how many days the test should run before evaluation.
Recommended: 14 to 30 days
Cart tests need sufficient time to capture:
Minimum duration: 14 days – Anything shorter risks capturing anomalies rather than true patterns.
Extended duration: 30+ days – Use for low-traffic stores or when testing subtle changes that require larger sample sizes to detect differences.
Enter your duration in days.
Example: Enter 21 for a three-week test.
The system will run the test for exactly this period unless you enable auto-stop (covered below).
Set the number of visitors required per variant before results are considered valid.
Default: 1,000 visitors per variant
This means the test needs at least 1,000 visitors in the control group AND 1,000 visitors in the variant group before statistical calculations are meaningful.
Why this matters:
Small samples produce unreliable results. If you evaluate a test with only 50 visitors per variant, random fluctuations can make a losing variant look like a winner.
When to adjust:
Increase to 2,000+ – For high-traffic stores where you can reach larger samples quickly. More data produces more reliable results.
Decrease to 500 – Only if your traffic is extremely low and you understand the increased risk of false positives. Not recommended for most stores.
The system won’t declare a winner until both variants reach this threshold, protecting you from premature conclusions.
Set how statistically strong the result must be before declaring a winner.
Default: 95% confidence
This means the system requires 95% certainty that the observed difference between control and variant is real, not random chance.
What this means in practice:
If the variant wins with 95% confidence, there’s only a 5% chance the result happened by luck. The variant genuinely performs better.
When to adjust:
99% confidence – Use for high-stakes tests where being wrong is costly (aggressive discounts, major cart changes). Requires larger sample sizes to reach significance.
90% confidence – Use when you need faster decisions and can tolerate slightly higher risk. Reaches significance with smaller samples but increases false positive risk.
For most cart tests, keep the default 95% confidence level.
Choose the metric that determines the winner.
For Cart and Discount tests, common options:
Conversion rate – Percentage of visitors who complete a purchase. Use this when your main goal is increasing the number of completed orders.
Cart-to-checkout rate – Percentage of visitors who proceed from cart to checkout. Use this when your test specifically targets cart abandonment.
Average order value – Mean cart value at checkout. Use this when your test aims to increase purchase size through threshold incentives.
Revenue per visitor – Total revenue divided by total visitors. Use this when you want to balance conversion rate and order value in one metric.
Select the metric that aligns with your test hypothesis.
Example: If your hypothesis states “Free shipping at $75 will reduce cart abandonment,” choose Cart-to-checkout rate as the primary metric.
Below the basic settings, detailed targeting filters appear. These let you run experiments on specific audience segments rather than all traffic.
Control which devices see the test.
Options:
When to use device targeting:
Mobile only – If your data shows mobile cart abandonment significantly exceeds desktop abandonment, test mobile-specific incentives without affecting desktop traffic.
Desktop only – If you want to test higher-value thresholds with desktop shoppers who typically have higher AOV.
Example use case: Your analytics show mobile abandonment at 75% vs desktop at 50%. Run a mobile-only cart test with a lower threshold ($50) since mobile cart values are typically smaller.
Restrict the test to specific visitor types.
Options:
When to use user type targeting:
New visitors only – Test first-purchase incentives designed to convert first-time shoppers without training existing customers to expect discounts.
Returning customers only – Test loyalty rewards or higher thresholds appropriate for customers already familiar with your products.
Example use case: Run two parallel tests: new visitors see 10% off at $50+ (acquisition-focused), returning customers see 15% off at $100+ (retention and AOV-focused).
Limit the test to visitors from specific channels.
Options:
When to use traffic source targeting:
Different traffic sources bring different intent levels. Paid traffic may be more price-sensitive, while organic search may convert at higher rates without incentives.
Example use case: Run the cart test only on paid traffic to improve ROAS while keeping organic traffic (which converts well already) incentive-free.
Run the test globally or limit it to specific regions.
Options:
When to use country targeting:
Single country tests – If different regions have different pricing structures, shipping costs, or purchasing power, test regionally appropriate thresholds.
High-value region focus – Test higher thresholds in regions with historically higher AOV.
Example use case: Test $100+ free shipping in the US where shipping costs are higher, while keeping the $50+ threshold in Canada where shipping is cheaper.
Control when the test runs.
Options:
When to use time targeting:
Peak traffic windows – Run tests during your highest-traffic periods to reach sample size faster.
Avoid promotional conflicts – Pause tests during site-wide sales or holiday promotions when discounts would conflict with existing offers.
Example use case: Run the cart test only Tuesday through Thursday to avoid weekend traffic spikes that might skew results.
Show the test only to visitors using specific browsers.
Options:
When to use browser targeting:
Rarely necessary for cart tests, but useful if you’ve identified browser-specific cart issues that need isolated testing.
Example use case: If Safari users show unusually high cart abandonment due to a technical issue, test a compensating incentive for Safari-only while you fix the underlying problem.
Target visitors arriving from specific websites.
Options:
When to use referrer targeting:
Partnership traffic – Test special offers for visitors arriving from partner sites or affiliates.
Influencer campaigns – Offer influencer-specific discounts to traffic from influencer links.
Example use case: Add google.com as referrer to test cart incentives specifically for Google search traffic, or facebook.com for Facebook ad traffic.
Focus the test on visitors from tracked campaigns.
Options:
Enter UTM key (like utm_source) and value (like google) to isolate campaign traffic.
When to use UTM targeting:
Campaign-specific landing pages – If you’re running paid campaigns with dedicated landing pages, test cart offers only for that campaign traffic.
Channel attribution – Test whether specific channels respond better to different threshold levels or discount amounts.
Example use case: Set utm_source=facebook and utm_campaign=spring2024 to test cart discounts only for your Facebook spring campaign, measuring whether the additional incentive improves ROAS.
Two automated controls appear at the bottom of the settings screen.
Toggle this ON to automatically end the test when statistical significance is reached.
How it works:
The system continuously monitors results as data accumulates. When the following conditions are ALL met, the test stops automatically:
Benefits:
When to disable:
Turn this OFF if you want to run the test for the full planned duration regardless of early results. Useful when you want to observe long-term patterns or seasonal effects.
Recommendation: Leave auto-stop enabled for most cart tests.
Toggle this ON to receive email updates about test milestones.
What you’ll receive notifications for:
Benefits:
Recommendation: Enable notifications for your first few tests until you’re comfortable with test cadence and duration.
A compact summary appears on the right side of the screen, confirming all your selections:
Review this summary carefully. These settings can’t be changed after launch without stopping and restarting the test.
Once everything looks correct, click Save and Next to proceed to the final review.
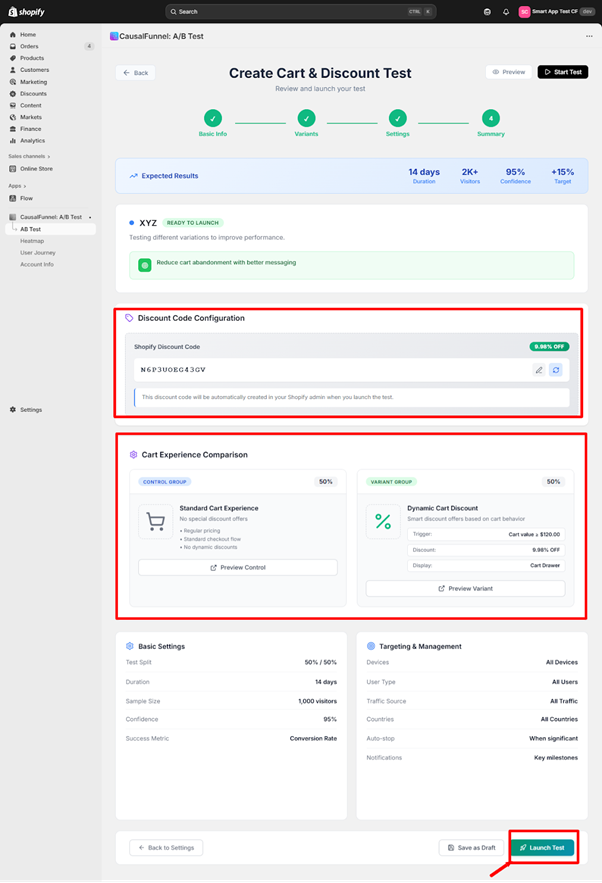
The final screen presents a comprehensive checklist before the test goes live. This is your last opportunity to catch configuration errors or make adjustments.
The top section displays projected test parameters:
Planned runtime – Number of days you set for test duration
Estimated visitor pool – Predicted number of visitors based on your recent traffic patterns
Confidence target – The statistical threshold (95%, 99%, etc.) required to declare a winner
Improvement target – The minimum lift needed to justify implementing the variant
Review these numbers to ensure they align with your hypothesis and business goals.
This section captures the actual discount code that will be created in your Shopify admin and applied at checkout.
Type the exact code customers will see and use.
Best practices for discount codes:
Example codes:
The system displays:
Critical verification:
Look at the displayed discount value and confirm the math:
If you entered 10% discount and threshold is $100, verify that:
What happens at launch:
When you click Launch Test, the system automatically creates this discount code in your Shopify admin with these settings:
Before launching, verify in your Shopify admin:
Check that no existing discount code conflicts with the one you’re creating. If “SAVE10NOW” already exists with different parameters, choose a different code name.
This section shows side-by-side previews of what shoppers will see in each test group.
Traffic share – Percentage of visitors assigned to control (typically 50%)
Customer experience – Description of what control group sees:
Preview Control button – Click this to open a live storefront preview showing exactly what control group visitors experience. This opens your actual cart page with no test modifications active.
Verification steps for control preview:
If anything looks wrong, the control group isn’t properly isolated and you should check your configuration.
Traffic share – Percentage of visitors assigned to variant (typically 50%)
Customer experience details:
Trigger condition – The rule that activates the discount:
Discount applied – Exact discount customers receive:
Discount code – The code that will be applied:
Message display location – Where customers see the offer:
Preview Variant button – Click this to open a live storefront preview showing the variant experience with discount message and code application.
Verification steps for variant preview:
Common issues to catch in preview:
Fix any issues now by clicking Back to Settings. Don’t launch until both previews work perfectly.
A full list of test configuration details appears:
Test split – Traffic distribution (50% control / 50% variant)
Duration – Number of days the test will run (14 days, 21 days, etc.)
Minimum sample size – Visitors per variant required for valid results (1,000 per variant)
Confidence level – Statistical threshold required to call a winner (95%)
Primary success metric – How the winner will be determined (Conversion rate, Cart-to-checkout rate, AOV, etc.)
Confirm these match your test plan. These settings lock at launch and can’t be changed mid-test.
All audience filters and automation settings are listed:
Verify all filters are correct. Incorrect targeting can invalidate your test by exposing it to the wrong audience.
Before clicking Launch Test, confirm every item on this list:
Discount code checks:
Message checks:
Math checks:
Targeting checks:
Technical checks:
If ANY item fails verification, click Back to Settings to fix it now.
Three buttons appear at the bottom:
Back to Settings – Returns to the configuration screen. Use this if you find errors during review.
Save as Draft – Saves the test configuration without launching. Use this if:
Drafts appear on your dashboard with “Draft” status. You can edit and launch them anytime.
Launch Test – Makes the experiment active immediately. When you click this:
What happens immediately after launch:
The app routes traffic according to your split. If you set 50/50:
The discount code is live in your Shopify admin. You can view it in: Shopify Admin → Discounts → [Your Code Name]
Don’t manually edit or delete this code during the test. It will break the experiment.
After clicking Launch Test, verify these items within the first hour:
Dashboard confirmation:
Shopify admin confirmation:
Traffic validation (check after 1-2 hours):
Live testing (do this from an incognito browser):
If any validation fails, pause the test immediately and review configuration.
After launch, the test runs automatically, but you should monitor progress to catch issues early and prepare for result interpretation.
Traffic distribution – Verify both variants are receiving approximately equal traffic (for 50/50 split). Small variations are normal, but if control has 800 visitors and variant has 50, something is wrong.
Error logs – Check for JavaScript errors, theme conflicts, or code application failures. The dashboard flags these if they occur.
Early conversion patterns – Don’t evaluate results yet, but watch for obvious catastrophic failures (variant converting at 0% while control converts at 5% suggests a broken flow).
Customer feedback – Monitor support tickets for confusion about discounts, messages not displaying, or codes not working.
Sample size progress – Track how close each variant is to minimum sample threshold. Estimate when the test will reach completion.
Metric trends – Observe whether the primary metric is trending up, down, or flat in the variant vs control. Again, don’t conclude anything yet, but watch for concerning patterns.
Secondary metrics – Check average order value, cart-to-checkout rate, and other supporting metrics to understand the full picture.
Segment performance – If you have enough data, filter by device, user type, or traffic source to spot segment-specific patterns.
Don’t change test settings – Any modification invalidates collected data. If you must make changes, stop the current test and start a new one.
Don’t manually apply the discount code site-wide – This contaminates the control group.
Don’t run conflicting promotions – Site-wide sales or other discounts during the test period skew results.
Don’t stop the test early – Even if variant is winning, let it run until significance is reached.
Don’t switch traffic mid-test – Changing traffic sources, launching new ad campaigns, or making major site changes affects both variants unpredictably.
Pause immediately if:
Technical failure – Discount code isn’t applying, messages aren’t displaying, checkout flow is broken for variant group.
Catastrophic performance drop – Variant conversion rate drops by 50%+ compared to control, suggesting something is seriously wrong.
Business circumstances change – Supplier issues, inventory problems, or other factors make the discount untenable.
Conflicting promotion launches – You forgot about a planned site-wide sale that conflicts with the test.
To pause: Open the test on your dashboard and click Pause Test. This stops new visitors from entering, but doesn’t delete collected data. You can resume later or analyze partial results.
When the test reaches significance (or your planned duration ends), it’s time to evaluate results and make decisions.
The completed test displays:
Winner declaration – “Variant wins,” “Control wins,” or “No significant difference”
Confidence level achieved – The statistical certainty of the result (95%, 99%, etc.)
Primary metric performance:
Secondary metrics:
Sample sizes:
The variant outperformed the control with statistical significance. This is the ideal outcome.
Next steps:
Publish the winner – Click Publish Variant to make the discount configuration live for all visitors. This:
Calculate impact – Determine the actual business impact:
Example calculation:
Test results:
Impact:
Document learnings – Record:
Plan next optimization – The winning variant becomes your new baseline. Ask:
The variant underperformed the original experience. The discount didn’t improve conversion enough to justify its cost, or actually hurt performance.
Next steps:
Archive the test – Mark it as completed without publishing. The discount code can be deactivated.
Analyze why it failed:
Threshold too high – If you required $100+ but the average cart is $60, few shoppers reached the threshold. Test a lower threshold next time.
Discount too small – A 5% discount may not motivate action when shoppers expect 15-20% off. Test a larger incentive.
Message unclear – Shoppers didn’t understand the offer or how to qualify. Improve copy clarity.
Wrong audience – The discount appealed to bargain hunters but your traffic consists of premium shoppers who don’t respond to discounts.
Timing issues – The test ran during unusual traffic patterns (holiday, sale, product launch) that skewed results.
Document learnings – Failed tests provide valuable insights:
Form new hypothesis – Based on why this failed, develop a different approach:
Neither variant clearly outperformed the other. The difference between control and variant is within the margin of error.
Possible interpretations:
The change is truly neutral – The discount doesn’t help or hurt conversion meaningfully. Shoppers are indifferent to this offer.
Sample size too small – The test didn’t run long enough or reach sufficient traffic to detect smaller differences. Consider extending.
Segment mixing – The discount works for one segment (mobile) but not another (desktop), and the averages cancel out. Analyze by segment.
Measurement issue – The primary metric chosen doesn’t capture the real impact. Check secondary metrics.
Next steps:
Extend the test – If traffic was low, run longer to accumulate more data. Small lifts require large samples to detect.
Segment analysis – Filter results by device, user type, traffic source. Look for hidden wins in specific segments.
Change primary metric – If you measured conversion rate but AOV increased significantly, the test may actually be a win.
Iterate with bigger change – If testing 5% off showed no difference, test 15% off to see if a larger incentive moves the needle.
Consider neutral as data – Sometimes learning that something doesn’t matter is valuable. You can focus testing efforts elsewhere.
Once you’ve run your first cart test successfully, these advanced approaches unlock deeper optimization.
Instead of testing a single threshold, test multiple tiers sequentially to find the optimal balance between conversion lift and discount cost.
Example sequence:
Test 1: $50 threshold, 10% discount
Test 2: $75 threshold, 10% discount
Test 3: $100 threshold, 10% discount
Optimal threshold is $75 where conversion lift and AOV increase balance best.
Run parallel tests targeting different segments with appropriate thresholds for each.
Example:
Mobile traffic test:
Desktop traffic test:
Both run simultaneously because device targeting prevents overlap.
After finding a winning threshold and discount, test messaging variations to optimize further.
Example test sequence:
Test 1: “You’re $X away from free shipping!” (outcome-focused) Test 2: “Add $X more to unlock 10% off” (savings-focused) Test 3: “Almost there! $X to go for your reward” (gamification)
Keep threshold and discount constant, vary only the copy.
Compare time-limited offers against evergreen discounts.
Control: “Spend $75 for free shipping” (no urgency) Variant: “Complete your order in 15 minutes for free shipping at $75” (urgency)
Measure whether urgency increases conversion enough to justify the complexity.
For stores where both approaches make sense, test which performs better.
Control: “Spend $100 get 10% off” Variant: “Buy 3 items get 10% off”
Measure impact on both conversion rate and average order value to find the optimal trigger type.
Test whether discounts are necessary for different customer types.
New visitor test:
Returning customer test:
Problem: You set a $150 threshold when your AOV is $80. Only 5% of shoppers reach the threshold, so the test has minimal impact.
Solution: Set threshold at or slightly above current AOV. Use analytics to find your 75th percentile cart value and test around that number.
Too large: Testing 50% off attracts bargain hunters who wouldn’t buy otherwise, skewing future expectations and destroying margin.
Too small: Testing 3% off when shoppers expect 15-20% produces no lift because the incentive is meaningless.
Solution: Research competitor offers, survey your audience, and test in the 10-20% range initially.
Problem: You launch a cart test during Black Friday when site-wide discounts are already running. The test results are meaningless.
Solution: Pause tests during promotional periods. Resume after traffic and offers return to baseline.
Problem: Variant wins with 8% conversion lift, but the 15% discount costs more in margin than the revenue gained from additional orders.
Solution: Always calculate net impact. Conversion lift alone doesn’t determine success if discount cost exceeds additional revenue.
Problem: After 5 days, you decide to change the threshold from $75 to $50 because the variant is underperforming.
Solution: Let the test run to completion with original settings. If you must change something, stop the current test and start a new one.
Problem: You test a $100 threshold that works on desktop, but mobile shoppers have $50 average carts and never reach it.
Solution: Analyze results by device. Consider running device-specific tests with appropriate thresholds for each.
Problem: Your message says “Qualify for savings!” but doesn’t specify the amount, threshold, or how to claim it.
Solution: Be explicit. “Spend $75 for free shipping” is better than “You’re almost there!”
Cart and Discount testing works best when combined with other CausalFunnel features.
Before running a cart test, review cart page heatmaps to understand behavior:
Use heatmap insights to form better cart test hypotheses.
Journey data shows the full path from product page to cart to checkout:
Prioritize cart testing when journey data shows cart is the primary drop-off point.
Use wins from one test type to inform the next:
Step 1: Review heatmaps and journey data to identify cart friction
Step 2: Run Element Test to fix cart page layout issues
Step 3: Run Cart and Discount Test to reduce abandonment with incentives
Step 4: Review updated heatmaps to confirm improved behavior
Step 5: Run follow-up cart test with refined threshold based on new AOV data
Each test builds on previous learnings, creating compound optimization gains.
Cart and Discount testing isn’t a one-time activity. It’s an ongoing optimization process that adapts to changing traffic patterns, competitive pressures, and business goals.
The continuous cart optimization loop:
The CausalFunnel Cart and Discount testing tool makes this loop fast and straightforward. You don’t need technical skills, data science expertise, or development resources. The entire workflow happens inside one Shopify app.
Start with a simple hypothesis based on clear data. Test it properly. Learn from the results. Iterate based on learnings. Over time, these incremental improvements compound into significant revenue gains and reduced abandonment rates.
Your first cart test begins with understanding why shoppers abandon. Review your cart abandonment data, identify the primary friction point, form a hypothesis, and configure your first test following this guide. The data will tell you what works for your specific audience, products, and price points.
Multisite for SEO is managing search optimization across multiple connected websites. Each site shares strategy, authority, and content guidelines. It helps businesses scale while maintaining strong rankings.
Yes, even small businesses benefit if planning multiple websites. Coordinated strategy ensures sites support each other. Proper setup prevents wasted effort and improves search visibility.
Use centralized analytics to track traffic, engagement, and conversions. Compare metrics across sites to identify strengths and weaknesses. Regular reporting ensures informed SEO decisions.
Audit at least quarterly or whenever adding a new site. Check content, links, technical SEO, and analytics. Proactive auditing prevents performance drops and long-term issues.
Avoid over-fragmenting domains, poor internal linking, duplicate content, and siloed execution. Maintain consistent technical setup and coordinated analytics.
Yes, coordinated sites strengthen authority and visibility. This drives consistent traffic, higher engagement, and better quality leads. Long-term results are stronger than isolated single-site SEO.
Multisite SEO ensures multiple websites work together rather than compete. It improves authority, user experience, and search engine visibility. Long-term traffic and leads increase when sites are coordinated properly.
Subdirectories consolidate authority under one domain, usually helping rankings. Subdomains separate content but may divide authority. The choice depends on business goals and scalability needs.
Assign unique keyword themes to each site. Ensure content angles differ and link primary pages strategically. Regular audits detect duplication before it affects rankings.
Start using our A/B test platform now and unlock the hidden potential of your website traffic. Your success begins with giving users the personalized experiences they want.
Start Your Free Trial
Empowering businesses to optimize their conversion funnels with AI-driven insights and automation. Turn traffic into sales with our advanced attribution platform.
Trusted by Customers


©CausalFunnel Inc. All rights reserved.