
")


Free Funnel Audit
Convert more customers today!
SEO
10 mins read

SEO
10 mins read
There is a quiet debate happening inside almost every Google Ads account right now. The ad manager is staring at their auction insights, watching competitors sit firmly at positions one and two, and wondering: “Is position three actually doing anything for us? Or are we just burning the budget to show up late to a party that’s already winding down?”
It is a fair question. And honestly, the answer is more nuanced than most PPC blogs will dive into.
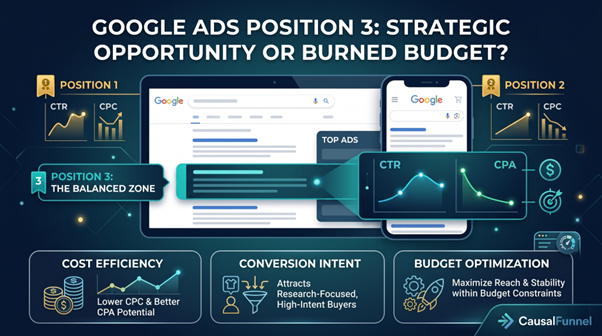
Position three is the last of the top ads Google typically shows above organic results. It is visible. It is technically “above the fold.” But it is also the position that gets the least love in strategy conversations, the one advertisers abandon first when budgets get tight, and the one that rarely shows up in case studies celebrating ROAS wins.
So let us actually dig into it. How often does position 3 show in Google Ads? What does the CTR data look like? And is there a real conversion argument for targeting it, or is it just a consolation prize?
Google does not assign a fixed position to your ad and leave it there. Every single search triggers a fresh auction, and your position changes based on Ad Rank, which is a function of your bid, Quality Score, expected click-through rate, ad relevance, landing page experience, and auction context.
So “position 3” is not a setting you lock in. It is an outcome. And that outcome can change hundreds or thousands of times a day depending on who else is bidding, what the search query was, what device was used, and what time of day it is.
What this means in practice:
This is an important context before looking at frequency data, because “how often does position 3 show” is not a clean, universal number. It depends heavily on your ad rank relative to the competition in each auction.
That said, the data still tells a revealing story.
Here is what the research shows. In a typical Google Ads auction on a competitive keyword, Google shows between three and four ads above organic results. Position three is the final slot in that top block, which means it is available in most auctions but only claimed by whoever holds the third highest Ad Rank in that auction.
Google measures ad prominence through its “Search top impression rate,” which tells you the percentage of your ad impressions that showed among top ads (above organic results). For position 3 specifically, a few realities shape how often it appears:
It shows less consistently than positions 1 and 2. If the auction only has two strong bidders with high Ad Rank, Google may show only two top ads and drop the rest below organic. Position 3 only fills if there is a third advertiser competitive enough to claim it.
In highly competitive verticals, it shows reliably. Legal, finance, SaaS, insurance, home services; in these categories, three or four advertisers almost always qualify for top placement. Position 3 here shows regularly.
In niche or low-competition markets, it is inconsistent. Sometimes the auction is thin. Position 3 shows up intermittently, and impressions can fluctuate significantly week over week.
Frequency also depends on your impression. If your impression share (lost to budget or rank) is high, you are missing auctions frequently, meaning your actual appearance at position 3 is even less consistent than your average position suggests.
The takeaway here is that position 3 can be a reasonably stable slot in competitive markets, but it is inherently the most volatile of the top three positions. It is the last to fill and the first to disappear when the auction gets thin.
This is where the numbers get uncomfortable.
Research on CTR by position shows that position 1 averages 7.94% CTR, position 2 averages 4.55%, and position 3 averages 2.55%.
Let that sink in for a second. That is a massive drop from top to bottom of the top three slots.
Ad Position | Average CTR |
Position 1 | 7.94% |
Position 2 | 4.55% |
Position 3 | 2.55% |
Position 4+ | Below 1.5% (estimated) |
Position 3 gets roughly one-third the clicks of position 1. This sits meaningfully below position 2 as well. The absolute top position receives 2 to 3 times more clicks than positions 2 through 4, which is why it is critical for brand campaigns and high-intent keywords. Dataslayer
The top paid search result has a 40% higher CTR than the second paid search result. So the gap between positions is not linear. It drops steeply, and position 3 sits at the bottom of that cliff.
And here is a data point that rarely gets mentioned: even at position 4 and beyond, high Quality Score ads averaging 2.8% CTR can outperform low Quality Score position 2 ads at 3.2%, indicating that relevance can partially offset position disadvantages.
Which tells you something useful. Position is only one piece of the puzzle. A sharp, well-written ad at position 3 with a strong Quality Score can actually outperform a lazy position 2 ad. Quality Score is not just a vanity metric. It actively changes the rules of the CTR game.
This is the real question. And the answer is: yes, but with important conditions.
Lower CTR does not automatically mean lower conversion quality. The users who do click on a position 3 ad are often slightly further into their research phase. They scrolled past two other ads to reach yours. They did not stop at the first result. That behavior suggests they are comparing options, which means they are likely closer to a decision, not farther from one.
The average conversion rate for Google Ads in 2025 is 7.52% across all industries, and this number is relatively consistent across ad positions, since conversion rate is more a function of your landing page, offer quality, and keyword intent than where your ad sat on the page.
Closing the gap between ad promise and landing page delivery is exactly what CausalFunnel’s Landing Page Optimizer is built for. It uses automated testing and behavioral data to find the version of your page that actually converts the traffic you are already paying for.
In 2025, while conversion rate dipped by 9.28% for ecommerce advertisers overall, click-through rates improved by 7.49%, suggesting a growing gap between ad promise and landing page delivery.
This is actually a position 3 argument in disguise. If your landing page converts well, the CTR disadvantage of position 3 shrinks in importance. You get fewer clicks but potentially similar or even better conversion rates, especially if your ad copy and landing page are tightly aligned with the searcher’s intent.
The industries where position 3 tends to hold up better in terms of conversion value:
Where position 3 tends to struggle:
Here is the thing most advertisers overlook when they obsessively chase position 1.
Cost per click increased for 87% of industries in 2025, with the overall average CPL rising from $66.69 to $70.11. Bidding for position 1 in a competitive market right now is expensive in a way that would have seemed absurd three years ago. Some industries saw CPC increases of over 40% year over year.
Position 3, by contrast, typically costs less per click. The Ad Rank required to claim it is lower than positions 1 and 2, and your actual CPC (which is based on the Ad Rank of the advertiser just below you) is correspondingly lower. For a campaign working with a fixed budget, lower CPC at position 3 can mean:
Run the math. If position 1 costs $8 per click and converts at 7%, your CPA is around $114. If position 3 costs $4.50 per click and converts at 6.5%, your CPA drops to around $69. That is a meaningful difference in budget efficiency, especially at scale.
But the math only holds up if the value of each acquired customer is clearly understood going in. That is where customer lifetime value modeling becomes essential. Position 3 at $69 CPA can look expensive on paper and wildly profitable in reality if that customer is worth $1,800 over 24 months.
Despite a 12.88% increase in CPC across industries in 2025, the 6.84% rise in average conversion rate helped balance cost increases for campaigns that were well optimized. The word “well optimized” is doing a lot of heavy lifting in that sentence. Position 3 strategies live or die on optimization quality more than almost anything else.
There are scenarios where intentionally targeting position 3 is not settling. It is a smart budget allocation.
If the decision is to operate at or around position 3, these are the metrics that matter most and why:
Metric | What to Watch For |
Search Impression Share | Should stay reasonably high. If it drops below 50%, budget or rank is limiting your consistency |
Impression Share Lost to Rank | If this is high, Quality Score improvements matter more than bid increases |
Impression Share Lost to Budget | If this is high, you are winning auctions but running out of money. Increase budget or tighten targeting |
CTR vs. Position Average | Your 2.55% benchmark. Beating it consistently means your ad copy is strong |
Conversion Rate by Position | Segment by top vs. other to see how position 3 converts relative to when you win higher spots |
CPA at Position 3 | The real test. Is acquiring a customer at position 3 profitable given your margin? |
Pulling all of this into one view rather than jumping between Google Ads reports and spreadsheets is where CausalFunnel’s Ads Optimizer becomes genuinely useful. It connects ad performance directly with on-site behavior, so position-level efficiency is visible without the manual gymnastics.
Monitoring your Impression Share Report in Google Ads helps track Search Impression Share, Lost IS due to rank, and Lost IS due to budget, all of which tell a different story about why your ad is or is not showing at the frequency you expect.
The honest answer is: it depends, but probably more than you think.
Position 3 is not the problem. Bad ad copy, misaligned landing pages, and unchecked budget waste are the problem. An advertiser with a 9/10 Quality Score, a well-structured campaign, and a strong offer can generate profitable conversions from position 3 consistently.
There is real proof of this across industries. CausalFunnel’s case studies show advertisers improving ROAS not by blindly chasing position 1, but by finding the most efficient position per keyword and building from there.
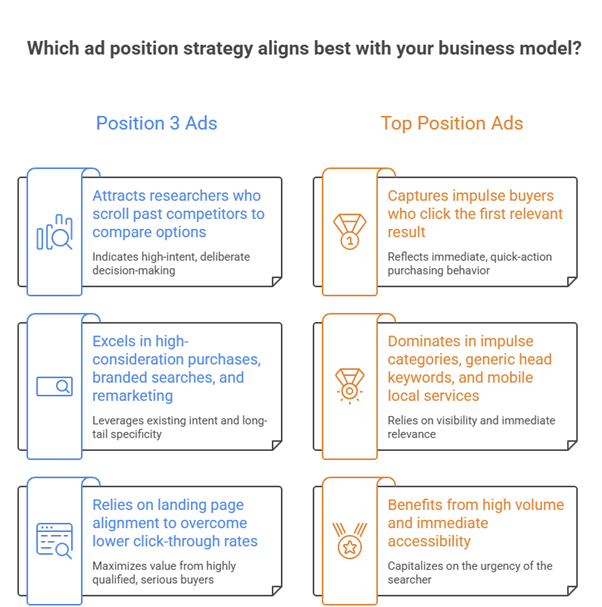
What position 3 is not good for: high-volume, fast-click, impulse-purchase categories where users grab the first relevant result and move on. In those situations, positions 1 or 2 are worth the premium because the click window is incredibly short.
What position 3 is good for: considered purchases, budget-conscious campaigns, keyword testing, remarketing setups, and any situation where conversion rate is strong enough that slightly lower CTR is an acceptable tradeoff for lower CPC.
The advertisers who get the most out of position 3 are the ones who treat it intentionally rather than accidentally. They land there by design, with optimized ad copy, Quality Scores above 7, and conversion tracking that actually tells them whether the economics work.
The main takeaway from 2025 benchmark data is that a smart strategy beats cheap clicks. Position 3, managed well, is a smart strategy. Position 3, stumbled into because of low bids and an ignored Quality Score, is just wasted spend.
The difference between the two is data, testing, and the willingness to actually look at what is happening in the auction rather than just assuming position 1 is always the answer.
Q1. How often does position 3 show in Google Ads compared to positions 1 and 2?
Position 3 fills in most competitive auctions where three or more advertisers meet the Ad Rank threshold for top placement. In highly competitive verticals like legal, insurance, or SaaS, it shows in the majority of auctions. In niche categories with fewer active bidders, it shows inconsistently and may sometimes not fill at all. Your Search Impression Share report inside Google Ads is the most reliable way to see how often your ads actually appear at any position relative to how often they were eligible to show.
Q2. Does position 3 in Google Ads convert as well as position 1?
Conversion rate is primarily driven by landing page quality, offer relevance, and keyword intent, not ad position alone. Research shows that position 3 averages a 2.55% CTR compared to 7.94% for position 1, so it generates fewer clicks. But the users who do click on a position 3 ad are often in comparison mode, which can mean they are closer to a purchase decision. For campaigns with strong landing pages and high-intent keywords, position 3 conversion rates can come close to position 1 rates while costing significantly less per click.
Q3. Is it better to bid for position 1 or accept position 3 to save budget?
It depends on your industry, margin, and campaign goals. For impulse purchases or time-sensitive local service queries (think emergency plumber or same-day delivery), position 1 is worth the premium because users click fast and pick the first relevant result. For considered purchases, SaaS demos, financial products, or high-value service leads, position 3 can generate comparable CPA at lower cost per click. The key is to run both scenarios in your own account with clean conversion tracking, rather than assuming position 1 always wins.
Q4. How do I improve my performance if my ads are consistently showing at position 3?
Start with Quality Score. A higher Quality Score at position 3 can produce CTRs well above the 2.55% average benchmark, since Google rewards ad relevance regardless of your actual placement. Make sure your ad copy speaks directly to search intent, your sitelinks and callouts are filled in, and your landing page loads fast and matches what the ad promises. Beyond that, add RLSA layers so past site visitors see your position 3 ads with better conversion probability, and use negative keywords aggressively to stop impressions on low-intent queries that waste your click budget at any position.
You can start small. Even $5-$10 per day works. Scale as you see results.
Most businesses use 7 to 30 days. High-ticket products may need longer windows
Yes. Despite privacy changes, they remain one of the highest ROI strategies.
Aim for 3-7 impressions per user per week. Too high leads to fatigue.
They are often used interchangeably. Retargeting usually refers to paid ads, while remarketing can include email follow-ups.
Start using our A/B test platform now and unlock the hidden potential of your website traffic. Your success begins with giving users the personalized experiences they want.
Start Your Free Trial
Empowering businesses to optimize their conversion funnels with AI-driven insights and automation. Turn traffic into sales with our advanced attribution platform.
Trusted by Customers


©CausalFunnel Inc. All rights reserved.