You want your customers to love your website. But to do that, your site must have features that excite them. It’s exactly here that A/B testing can help. It eliminates all the guesswork out of what will work. It gives you real insights that help you discover and optimize the best features of your site.
An effective A/B testing methodology helps you quantify your theories to practical data. This, in turn, lets you develop better offerings for your customers.
What Is A/B Testing?
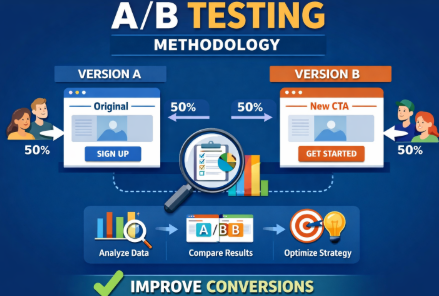
A/B testing is also called split testing. It’s a controlled and randomized experiment. This testing compares two variants of a web page or an app. Then, it finds out which performs better. This finding is based on user engagement and conversion metrics. Wikipedia
Key Aspects of A/B Testing
Methodology
Users are divided into two groups. One group is exposed to the original version. This is also called the control version. The other group sees the changed version.
Common Variables
Common elements tested include:
- Headlines
- Call-to-action (CTA) buttons
- Images
- Colors, or
- Page layout.
Goal
The core goal is to improve conversions and engagement. This is done by finding out which variant is liked by users more.
Process
A/B testing involves setting a hypothesis. Then, it defines success metrics. This can be clicks or time on page. Then, it runs a test to find out statistical significance. Based on that the winner’s version is decided.
Qualitative Research as a Pre-Test Step
Before running an A/B test, you must know why people behave in a specific way. Qualitative research gives you that information. Figures alone cannot give you that. Using this step, you can identify what to test and create better hypotheses.
1. Heatmaps
- Show where users click, scroll, or hover on a page.
- Highlight hot zones and ignored areas.
- Example: Suppose users hardly reach a CTA at the bottom. In this case, test moving it to the top.
Popular tools: Hotjar, Microsoft Clarity, Contentsquare
2. Session Recordings
- Record real user sessions. This will enable you to gauge how people navigate your site.
- Discover layouts that bewilder users.
- Example: Users abandon checkout because they can’t understand what a form field means.
3. Surveys & Polls
- Ask users direct questions about their experience.
- Can be on-site popups, emails, or post-purchase surveys.
- Example: “What stopped you from completing your purchase?”
4. User Feedback & Interviews
- Collect in-depth insights from a sample of real users.
- Helps uncover pain points and motivations that analytics can’t show.
- Example: Users might dislike a specific headline or image.
How It Supports A/B Testing
- Generates data-driven hypotheses.
- Ensures tests target real user issues, not guesswork.
- Improves test relevance and increases chance of meaningful results.
Mini Table: Pre-Test Methods
Method | Insight Type | Example Use Case | Tool Examples |
Heatmap | Clicks, scrolls, attention | Identify ignored CTAs | Hotjar, Clarity, Contentsquare |
Session Recording | Navigation flow | Detect confusing form fields | Hotjar, Contentsquare |
Surveys | User opinions | Understand objections | Typeform, Google Forms |
Interviews | In-depth motivations | Guide major UX changes | Zoom, Lookback.io |
Why Methodology Matters
A structured approach ensures accurate results. Skipping methodology makes businesses derive wrong conclusions.
Common pitfalls:
- Stopping tests too early.
- Testing multiple variables without clear control.
- Misinterpreting data.
Real-world impact
Bad methodology can mislead marketing decisions. Here is an example. Changing a CTA color without proper testing might lower signups instead of increasing them.
Step‑by‑Step A/B Testing Methodology
Step 1: Define Your Objective & Hypothesis
Every successful A/B test starts with a clear objective. Ask yourself: What do I want to improve? Having a defined goal keeps your test focused and measurable.
Example objectives:
- Increase newsletter signups.
- Improve checkout completion.
- Boost click-through rates.
Using the S.M.A.R.T. Hypothesis Framework
A strong hypothesis is S.M.A.R.T. Specific, Measurable, Achievable, Relevant, and Time-bound. This makes your test actionable and easy to track.
S.M.A.R.T. Hypothesis Example:
“Changing the CTA from ‘Sign Up’ to ‘Get Started’ on the homepage will increase newsletter signups by 10% over two weeks.”
Hypothesis Examples Across Different Scenarios
Business Type | Objective | Hypothesis Example |
E-commerce | Increase product purchases | “Adding a ‘Free Shipping’ badge on product pages will increase purchases by 8% within 14 days.” |
SaaS | Boost trial signups | “Replacing ‘Start Free Trial’ with ‘Try for Free’ on the pricing page will increase trial signups by 12% over one week.” |
Email Marketing | Improve open rates | “Changing the subject line from ‘Weekly Newsletter’ to ‘Top Deals This Week’ will increase open rates by 15% in the next campaign.” |
Landing Page | Reduce bounce rate | “Adding a testimonial section above the fold will decrease bounce rate by 5% within 10 days.” |
Step 2: Identify the Variable to Test
Choose one element to test.
Examples:
- Headline text.
- Call-to-action button.
- Page layout or image.
Control vs Variant:
- Control: current version.
- Variant: new version you want to test.
Step 3: Choose Metrics & Success Criteria
Once you know what to test, the next step is to pick metrics that tell you if your test worked. Not all metrics are equal. Some show the main goal, others help monitor side effects.
Primary vs. Secondary Metrics
- Primary metric: This is the main goal of your test. It measures whether your hypothesis succeeds.
- Example: For a CTA test, the newsletter signup rate is the primary metric.
- Secondary metrics: These give extra insight into user behavior but aren’t the main goal.
- Example: Click-through rate (CTR), scroll depth, or time on page.
Common Metrics and When to Use Them
Metric | When to Use | Industry Benchmarks / Notes |
Conversion rate | Anytime you want users to take a specific action (purchase, signup, download) | E-commerce average: 2–4%; SaaS trial signup: 5–7% |
Click-through rate (CTR) | For links, buttons, or email campaigns | Email campaigns average CTR: 2–5%; landing page buttons: 5–10% |
Engagement metrics (time on page, scroll depth) | For content-heavy pages or onboarding flows | Average time on page: 1–3 minutes; scroll depth: 50–80% is typical for articles |
Guardrail Metrics
Guardrail metrics are side metrics you monitor to make sure your test doesn’t cause unintended harm.
- Example: If your CTA test improves signups but increases bounce rate, the test might be hurting UX.
- Examples of guardrails:
- Bounce rate
- Cart abandonment
- Support ticket volume
What Is a Meaningful Improvement
This is dependent on your traffic and domain. Your business goals also matter.
- Typical improvement ranges:
- E-commerce: +5–10% in conversions
- SaaS trial signups: +10–15%
- Email open rates: +2–5%
Statistical Considerations
- Decide your confidence level (usually 95%).
- Set your minimum detectable effect (MDE). It is the smallest change you care about.
- Make sure sample size supports detecting that effect.
Step 4: Determine Sample Size & Duration
Choosing the right sample size and test duration is critical. Too small, and results may be inaccurate. Too large, and you waste time and resources.
Key Factors to Consider
- Current traffic: How many visitors see the page or feature daily.
- Expected effect size: The improvement you hope to detect (e.g., 5% more signups).
- Confidence level: Usually set at 95%, meaning you can be 95% sure the result isn’t due to random chance.
- Statistical power: Usually 80%, which is the likelihood your test will detect a real effect.
- Minimum Detectable Effect (MDE): The smallest change you care about. This sets the threshold for what improvement is meaningful.
How to Calculate Sample Size
You can use free online calculators, such as Evan Miller’s A/B test sample size calculator.
Steps:
- Enter your current conversion rate.
- Enter the expected effect size (MDE).
- Choose confidence level (95%) and power (80%).
- Calculator gives the recommended sample size per variant.
This ensures your test is statistically valid and can detect meaningful improvements.
Mini Table: Sample Size Reference
Expected Improvement | Sample Size per Variant | Notes |
5% | 1,000 | Small effect; high traffic needed |
10% | 500 | Medium effect; typical for most tests |
20% | 200 | Large effect; can test with smaller audience |
Tip: Always round up slightly to account for traffic fluctuations or data errors.
Determining Test Duration
- Depends on traffic volume and sample size needed.
- Low-traffic pages may need 2–4 weeks.
- High-traffic pages can finish in a few days.
- Avoid stopping early; results may not be reliable.
Quick Checklist for Step 4:
- Determine baseline conversion rate.
- Decide MDE.
- Set confidence level (95%) and power (80%).
- Use a calculator to find sample size.
- Plan duration based on traffic and sample size.
Hypothesis Prioritization Frameworks
When you have many A/B testing ideas, it can be hard to decide which one to run first. Using a prioritization framework helps. Two popular models are PIE and ICE.
1. PIE Framework
PIE stands for Potential, Importance, Ease.
- Potential: How much improvement could this change bring?
(Example: Changing a main CTA could increase conversions by 10%.) - Importance: How critical is this page or feature to your business?
(Example: Checkout page has high importance, blog sidebar low importance.) - Ease: How simple is it to implement the change?
(Example: Updating a headline is easy; redesigning the checkout flow is harder.)
How to score:
Assign 1–10 for each factor. Add the scores. Higher total = higher priority.
Mini Table Example:
Test Idea | Potential | Importance | Ease | Total Score |
CTA color change | 7 | 9 | 10 | 26 |
New landing layout | 8 | 8 | 6 | 22 |
Email subject line | 6 | 5 | 9 | 20 |
2. ICE Framework
ICE stands for Impact, Confidence, Ease.
- Impact: How much difference will the change make?
- Confidence: How sure are you that it will work?
- Ease: How easy is it to implement?
How to score:
Rate each 1–10, then multiply: Impact × Confidence × Ease. Higher score = higher priority.
Mini Table Example:
Test Idea | Impact | Confidence | Ease | ICE Score |
CTA wording | 8 | 7 | 9 | 504 |
Hero image swap | 6 | 5 | 8 | 240 |
Footer redesign | 5 | 6 | 7 | 210 |
Why Use These Frameworks?
- Helps focus on tests that deliver the most value.
- Prevents wasting time on low-impact ideas.
- Makes your A/B testing process more strategic and efficient.
Step 5: Set Up the Test
Use a testing tool:
Setup steps:
- Randomly assign visitors to control or variant.
- Ensure tracking is accurate.
- Confirm baseline metrics.
A/A Testing: Why It Matters
Before running an A/B test, it can be smart to run an A/A test. This means testing two identical versions of a page or element. You aren’t trying to find a winner. The goal is to validate your testing setup.
What Is A/A Testing?
- Run two identical versions (A vs A).
- Measure metrics like conversion rate, clicks, or engagement.
- Check that results are statistically similar.
Why Run an A/A Test?
- Validate Your Tools:
Ensure your platform (Optimizely, AB Tasty, Kameleoon) correctly tracks traffic and metrics.
- Check Randomization:
Confirm visitors are randomly assigned to versions.
- Detect Flaws Early:
Catch issues like tracking errors, faulty code, or biased traffic.
- Build Confidence:
If an A/A test shows no significant difference, you can trust future A/B test results.
How to Run an A/A Test
- Pick the page or element to test.
- Duplicate it exactly (Control vs Control).
- Run the test for the usual duration.
- Compare metrics; small variations are normal.
- Investigate any large discrepancies before starting real A/B tests.
Mini Example Table:
Metric | Version A | Version A | Difference |
CTR | 5.01% | 4.98% | 0.03% |
Conversions | 102 | 101 | 1 |
Bounce Rate | 38% | 37.8% | 0.2% |
In this example, differences are minor. The setup is validated and ready for a true A/B test.
Step 6: Run the Test & Monitor
Run the test for the planned duration.
Tips:
- Watch trends but do not stop early.
- Avoid making changes mid-test.
- Monitor for anomalies or errors.
Warning: Stopping a test too soon can give false positives.
Step 7: Analyze Results & Implement Findings
Once your A/B test has finished, the next step is to analyze results carefully. How you interpret data determines whether your decisions are smart or misleading.
Key Statistical Steps
Check conversion rate differences: Compare the primary metric between control and variant.
Calculate confidence intervals: This shows the range where the true effect likely falls.
Determine statistical significance: Usually at 95% confidence. If results fall outside expected random variation, the difference is likely real.
Segmentation Is Critical
Don’t just look at the overall numbers. Segment results by:
Device: Desktop vs mobile
Traffic source: Paid ads, organic, email
Audience type: New vs returning visitors, location, age
Example: A CTA change may improve desktop conversions but have no impact on mobile users. Segmenting avoids misleading conclusions.
Handling Different Outcome Scenarios
1. Clear Winner:
Example:
Control CTA: 5% signup
Variant CTA: 7% signup
95% confidence → significant
Action: Implement variant as new default.
2. Marginal Improvement:
Example: Variant improves 5% → 5.2%
Check confidence intervals; often the improvement is not statistically meaningful.
Action: Consider running another test, or test a different variation.
3. Inconclusive Results:
Small sample size or low traffic may lead to no clear winner.
Action: Extend the test duration or increase sample size. Do not make decisions too early.
Watch Out for Regression to the Mean
Sometimes unusually high or low results naturally return to average in subsequent tests.
Avoid declaring a winner from an outlier.
Use historical data to verify if results are realistic.
Mini-Case Example (Expanded)
Metric | Control CTA | Variant CTA | Difference | Significance |
Newsletter Signups | 5% | 6% | +1% | 95% CI → significant overall |
Desktop | 6% | 8% | +2% | Significant |
Mobile | 4% | 4.2% | +0.2% | Not significant |
Paid Traffic | 5% | 7% | +2% | Significant |
Organic | 5% | 5.1% | +0.1% | Not significant |
Takeaways:
Variant performs better overall and for desktop/paid users.
Mobile and organic traffic show minimal change → may need separate testing.
Confidence intervals confirm the overall lift is real, not random noise.
Implementing Findings
Apply changes where results are significant.
Document learnings for future tests.
Plan follow-up experiments for segments with inconclusive or marginal results.
Keep iterating: A/B testing is a cycle, not a one-time event.
Frequentist vs. Bayesian Statistics
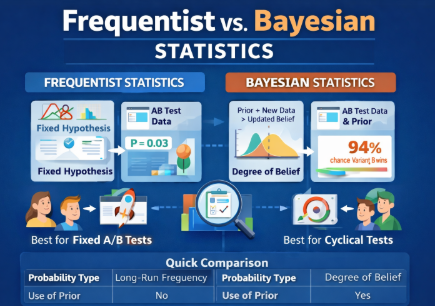
Understanding statistics is key for interpreting A/B test results. Two main approaches are Frequentist and Bayesian. Both are valid but have different uses.
1. Frequentist Statistics
- Based on long-run probabilities.
- Uses a fixed hypothesis and tests data against it.
- Reports p-values and confidence intervals.
- Example: “There is a 95% chance the observed difference is not due to random chance.”
When to use:
- Standard A/B tests with clearly defined sample size.
- Scenarios where you want a fixed stopping point.
- Classic experiments like landing page tests or email campaigns.
Pros: Simple to explain and widely understood.
Cons: Can’t update probabilities as new data comes in.
2. Bayesian Statistics
- Uses prior knowledge combined with new data.
- Reports probabilities of outcomes directly.
- Example: “There is a 92% chance that Variant B outperforms Variant A.”
When to use:
- You want continuous learning as data arrives.
- Useful for smaller sample sizes or ongoing experiments.
- Helpful when prior data or expertise exists.
Pros: Flexible and intuitive for decision-making.
Cons: Slightly more complex to calculate and explain.
Quick Comparison Table
Feature | Frequentist | Bayesian |
Probability Type | Long-run frequency | Degree of belief |
Use of Prior Data | No | Yes |
Output | P-values, confidence intervals | Probability of outcomes |
Best For | Fixed-duration A/B tests | Continuous or sequential testing |
Complexity | Simple | Moderate |
Step 8: Iterate & Continuous Optimization
A/B testing is ongoing. Learn from results and test next ideas.
Cycle:
- Analyze results.
- Generate new hypotheses.
- Run new tests.
Continuous optimization ensures steady growth and UX improvements.
Common Mistakes in A/B Testing Methodology
- Stopping tests too early.
- Testing too many variables at once.
- Ignoring segmentation or sample size.
- Misinterpreting statistical results.
Avoid these to maintain accurate insights.
Real-World Examples of A/B Testing Methodology
Case 1: CTA Change
- Objective: Increase newsletter signups.
- Control: “Sign Up Now” button.
- Variant: “Get Your Free Guide” button.
- Result: Variant +15% signups.
- Methodology applied: Clear hypothesis, proper sample size, 2-week test.
Case 2: Landing Page Layout
- Objective: Reduce bounce rate.
- Control: Standard layout.
- Variant: New layout with prominent testimonial.
- Result: Bounce rate dropped 8%.
- Methodology: One variable, tracked engagement, confidence level 95%.
Case 3: Email Subject Line
- Objective: Increase open rate.
- Control: “Weekly Update”
- Variant: “Top Deals This Week”
- Result: Open rate +12%.
- Methodology: Segmented audience, statistical analysis.
Tools & Resources for 2026
Platforms:
Analytics & Stats Tools:
- Google Analytics
- Tableau
- R or Python for advanced analysis
Documentation:
- Templates for hypothesis, variables, and metrics.
- Tracking test duration and results.

")