



Free Funnel Audit
Convert more customers today!
SEO
10 mins read

SEO
10 mins read
Many businesses lose customers and revenue without realizing the real reason behind it. They spend on marketing, launch new products, and change strategies constantly. Still, growth feels slow and unpredictable for many business owners.
The problem usually is not the lack of effort anymore. The real problem is missing business insights hidden inside the data already available.
Businesses already collect useful data like website visits, customer feedback, sales reports, and marketing performance. All these data reveal important growth opportunities. However, most businesses never analyze that information properly.
That is why learning how to analyze data for your business is important. A simple data analysis process helps businesses make smarter decisions. It also helps improve sales, reduce wasted spending, and strengthen customer retention faster.
The best part of analyzing data for your business is that it doesn’t need any technical expertise anymore. With the right framework, even beginners can understand business trends and make confident decisions.
This guide breaks the process into five simple and practical steps anyone can follow successfully.
So, what does data analysis mean in business? It simply means studying information to make smarter business decisions consistently. While data analysis in a business, companies collect information from customers, sales, websites, and marketing campaigns daily. That information becomes useful when businesses organize and analyze it properly.
Businesses use data analysis to understand what works and what needs improvement. So, instead of relying on opinions, companies use facts to guide future decisions. This approach reduces risks and improves long-term business performance significantly.
The data analysis process steps usually involve collecting, organizing, analyzing, and applying information carefully. Businesses use these steps to solve problems and discover new growth opportunities faster.
Companies commonly analyze data such as:
For example, an online clothing store noticed high cart abandonment rates recently. After analyzing customer behavior data, the company found that expensive shipping costs caused frustration among the customers. The company then introduced free shipping for larger orders and that increased conversions quickly.
Business data analysis helps companies answer important questions clearly:
Without data analysis, businesses often make decisions based on assumptions instead of evidence. That usually creates unnecessary problems and slows future growth opportunities.
Many businesses collect large amounts of information every single day. However, collecting data alone does not guarantee smarter business decisions. Without a clear process, businesses often become overwhelmed and confused quickly.
Some companies even track too many unnecessary metrics without understanding their actual business impact. Others create reports regularly but never use the findings effectively. These problems often waste valuable resources and delay important business improvements.
Businesses commonly struggle with issues like:
Doing a structured data analysis process solves these problems much more effectively. After the analysis, businesses can focus only on meaningful information connected directly to company goals. This approach improves clarity, accuracy, and decision-making speed significantly.
| Without Data Analysis | With Data Analysis |
| Guesswork | Better decisions |
| Wasted marketing budget | Improved ROI |
| Unclear customer behavior | Better targeting |
| Slow growth | Smarter scaling |
Furthermore, a clear process also helps teams work more efficiently together. Everyone understands which metrics matter and how results affect business performance. That creates stronger alignment across marketing, sales, customer support, and operations teams.
For example, a business might notice declining sales during specific months annually. Proper analysis could reveal seasonal buying behavior instead of product quality problems. That insight helps businesses prepare better campaigns during slower periods.
Data analysis also improves business confidence during uncertain market conditions. Instead of reacting emotionally, businesses make decisions supported by real evidence and trends.
Platforms like CausalFunnel help businesses simplify this entire process significantly. Their AI-powered analytics, funnel tracking, and customer journey analysis tools help companies identify growth opportunities faster. Businesses can also improve attribution tracking and understand which channels generate higher-quality conversions.
Over time, structured analysis creates better customer experiences, stronger marketing performance, and faster business growth.
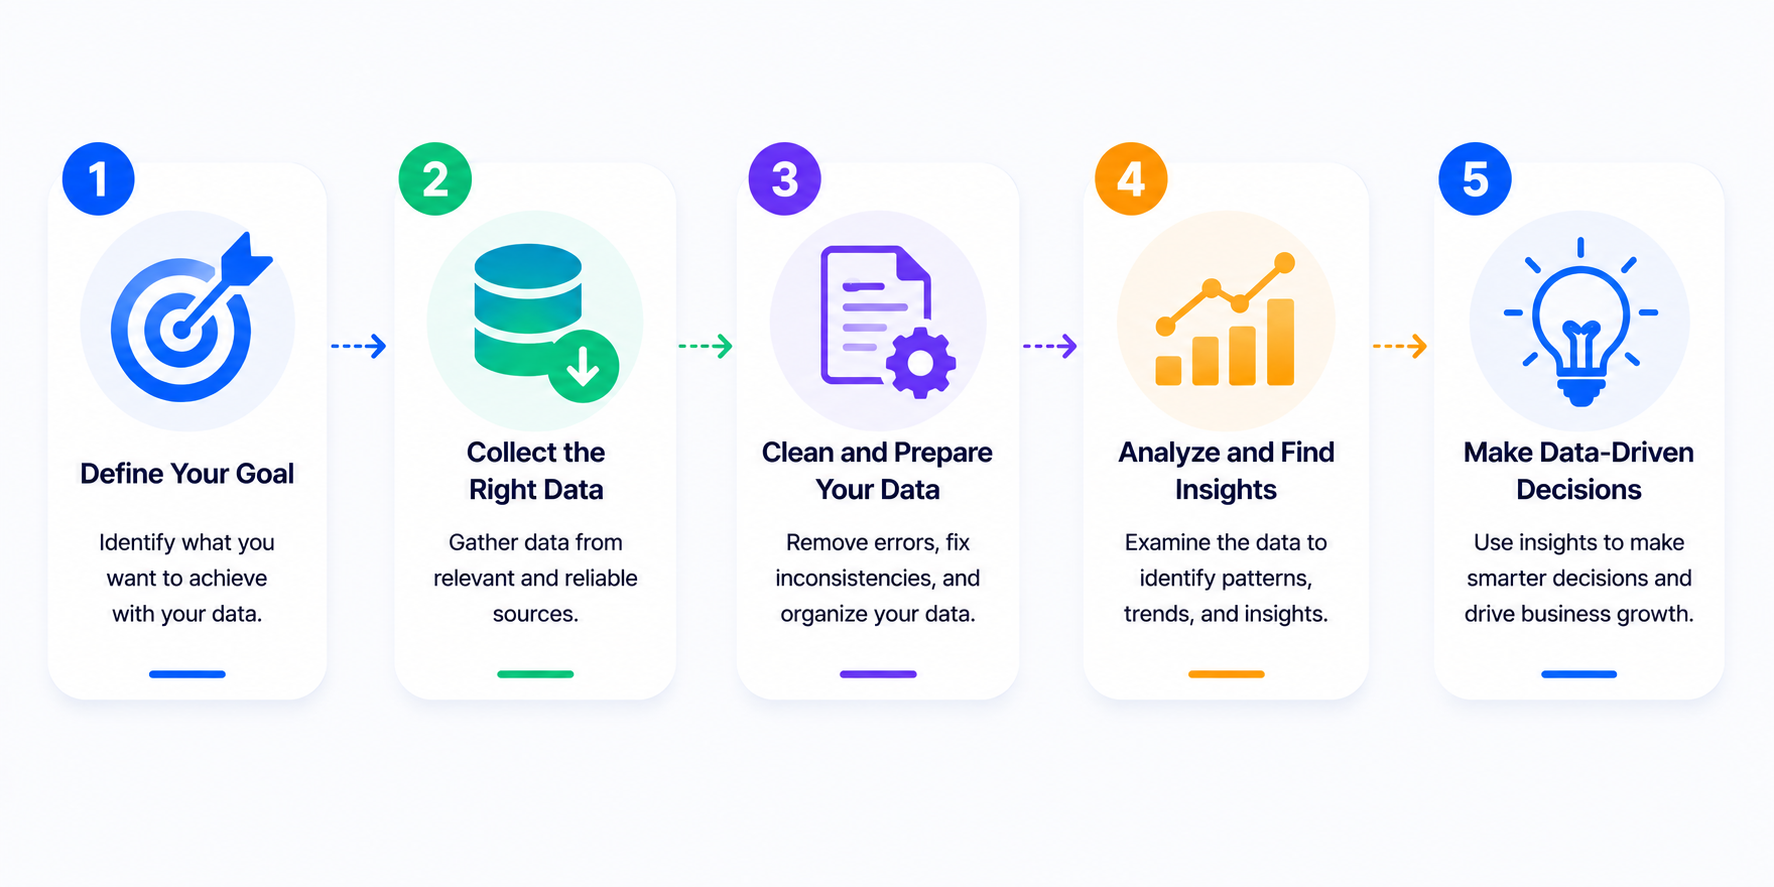
Many businesses overcomplicate data analysis and delay taking meaningful action unnecessarily. The process becomes much easier when businesses follow a structured framework consistently.
Understanding how to analyze data for your business in 5 steps helps simplify decision-making greatly. Each step builds naturally on the previous one and improves overall business understanding.
Here are the five core steps businesses should follow:
Following these steps helps businesses avoid confusion, reduce wasted effort, and improve results faster.
Every successful data analysis process starts with a clear business objective first. Without a goal, businesses often collect information without understanding its actual purpose.
Having a clear goal helps businesses focus only on useful and relevant information consistently. It also prevents teams from wasting time analyzing meaningless metrics unnecessarily.
Many businesses make the mistake of setting vague goals without measurable outcomes. That approach creates confusion because nobody understands what success actually looks like.
Here is a simple example:
The second goal works better because it feels measurable and realistic clearly. Businesses can track progress and evaluate results much more effectively afterward.
SMART goals can improve the process significantly for beginners. SMART stands for:
Businesses should connect every analysis effort directly to business growth objectives consistently. Otherwise, teams may analyze interesting information without generating valuable business outcomes.
For example, a local restaurant may want stronger customer retention this year. Instead of tracking random website traffic numbers, they focus on repeat customer visits. That goal makes data collection and reporting much more useful later.
Common mistakes businesses make during goal-setting include:
Businesses should also avoid changing goals too frequently during analysis periods. This is because constant goal changes create inconsistent reporting and confusing business insights.
When you have a clear goal, it makes every following step easier and more effective. Businesses understand what data matters and which metrics deserve attention immediately.
Most importantly, strong goals help businesses connect analysis directly to measurable business growth.
KPI stands for Key Performance Indicator that are measurable values businesses use to track performance and business progress.
These metrics help businesses understand whether goals are improving or declining consistently. Good KPIs connect directly to important business objectives and measurable outcomes.
Many businesses track impressive-looking numbers without understanding their actual business value. Those numbers are often called vanity metrics because they rarely improve decision-making.
For example, social media likes may look impressive publicly. However, likes alone do not guarantee higher sales or stronger customer retention. Businesses should focus on actionable metrics that influence real business growth consistently.
| Business Goal | Useful KPI |
| Increase sales | Conversion rate |
| Improve retention | Repeat purchase rate |
| Grow traffic | Organic traffic |
| Improve support | Customer satisfaction score |
Different departments often track different KPIs based on business priorities.
Marketing KPIs may include:
Sales KPIs may include:
Customer service KPIs may include:
Businesses should avoid tracking too many KPIs simultaneously as too much information often creates confusion and weakens focus significantly.
Instead, businesses should prioritize metrics connected directly to current goals. That approach improves reporting clarity and decision-making speed greatly.
For example, an online business focused on customer retention should prioritize repeat purchase rates. Tracking unrelated metrics may distract teams from solving important retention problems.
Useful KPIs help businesses identify opportunities, weaknesses, and growth patterns much faster. They also make reporting simpler for teams and business leaders.
Strong KPI selection prevents data overload and improves business focus consistently.
After identifying KPIs, businesses must collect accurate and useful information carefully. Good decisions depend heavily on high-quality data sources and consistent reporting methods.
Businesses today collect data from many different platforms and customer interactions daily. However, not all information provides meaningful business value equally.
Relevant business data usually includes:
First-party data has become especially valuable for businesses recently. This information comes directly from customer interactions and company-owned platforms.
Examples of first-party data include:
Businesses often use several tools to collect and organize information effectively.
| Data Source | What It Helps Measure |
| Google Analytics | Website behavior |
| CRM software | Customer interactions |
| Surveys | Customer feedback |
| Social media insights | Engagement trends |
Google Analytics helps businesses understand website traffic and visitor behavior clearly. On the other hand, CRM software tracks customer interactions, buying history, and lead management activities.
Customer surveys provide direct feedback about products, services, and user experiences. Social media insights reveal audience engagement and content performance trends.
Businesses can collect data manually or automatically depending on company size and resources.
Manual collection methods may include:
Automated collection methods may include:
Automation saves time and reduces human reporting errors significantly over time. Also, businesses should prioritize data accuracy during collection stages. Poor-quality data creates misleading reports and weak business decisions later.
Common data quality problems include:
For example, incorrect website tracking may inflate traffic numbers artificially. Businesses could then increase advertising budgets based on inaccurate information.
If the data collected is properly organized, it creates stronger reporting and more reliable business insights later. It also helps businesses analyze trends more confidently and accurately.
This step transforms raw information into meaningful business insights and practical recommendations. At this stage, businesses finally begin understanding what their data actually reveals clearly.
However, analysis becomes difficult when businesses use messy or incomplete information. That is why data cleaning matters before deeper analysis begins.
Data cleaning usually involves:
Clean data improves reporting accuracy and reduces misleading business conclusions significantly.
For example, duplicate customer entries may inflate customer growth numbers incorrectly. Removing those duplicates creates more reliable reporting immediately.
After cleaning data, businesses can begin identifying patterns, trends, and performance issues carefully. Businesses often use data visualization tools to simplify complex information visually. They read data using charts, graphs, and dashboards that help teams understand trends much faster.
Common visualization methods include:
Line charts work especially well for tracking monthly sales or traffic changes. Bar charts help businesses compare campaign performance across different channels clearly.
Dashboards combine multiple KPIs into one simple reporting view conveniently. That approach improves reporting efficiency for business owners and teams.
Businesses also use different types of analysis depending on business objectives.
| Analysis Type | Purpose |
| Descriptive | What happened |
| Diagnostic | Why it happened |
| Predictive | What may happen |
| Prescriptive | What action to take |
Descriptive analysis explains past business performance using historical information clearly. Businesses use it to understand trends, traffic, and customer behavior.
Diagnostic analysis identifies reasons behind business changes or performance problems. For example, businesses may discover lower conversions caused declining sales recently.
Predictive analysis estimates future outcomes using past business trends and patterns. Businesses often use predictive analysis for sales forecasting and inventory planning.
Prescriptive analysis recommends actions businesses should take after reviewing insights carefully.
For example, an ecommerce company notices declining conversions from paid advertisements recently. After analyzing website behavior, they discover slow landing page speeds caused visitor frustration.
The business improves page speed and increases conversions significantly afterward.
Businesses also use several beginner-friendly tools during this stage.
Popular tools include:
Google Analytics helps businesses track website performance and customer journeys effectively. Looker Studio creates simple dashboards and visual reports for teams.
Tableau works well for advanced dashboards and larger data visualization projects. Excel remains useful for smaller businesses needing simple reporting systems.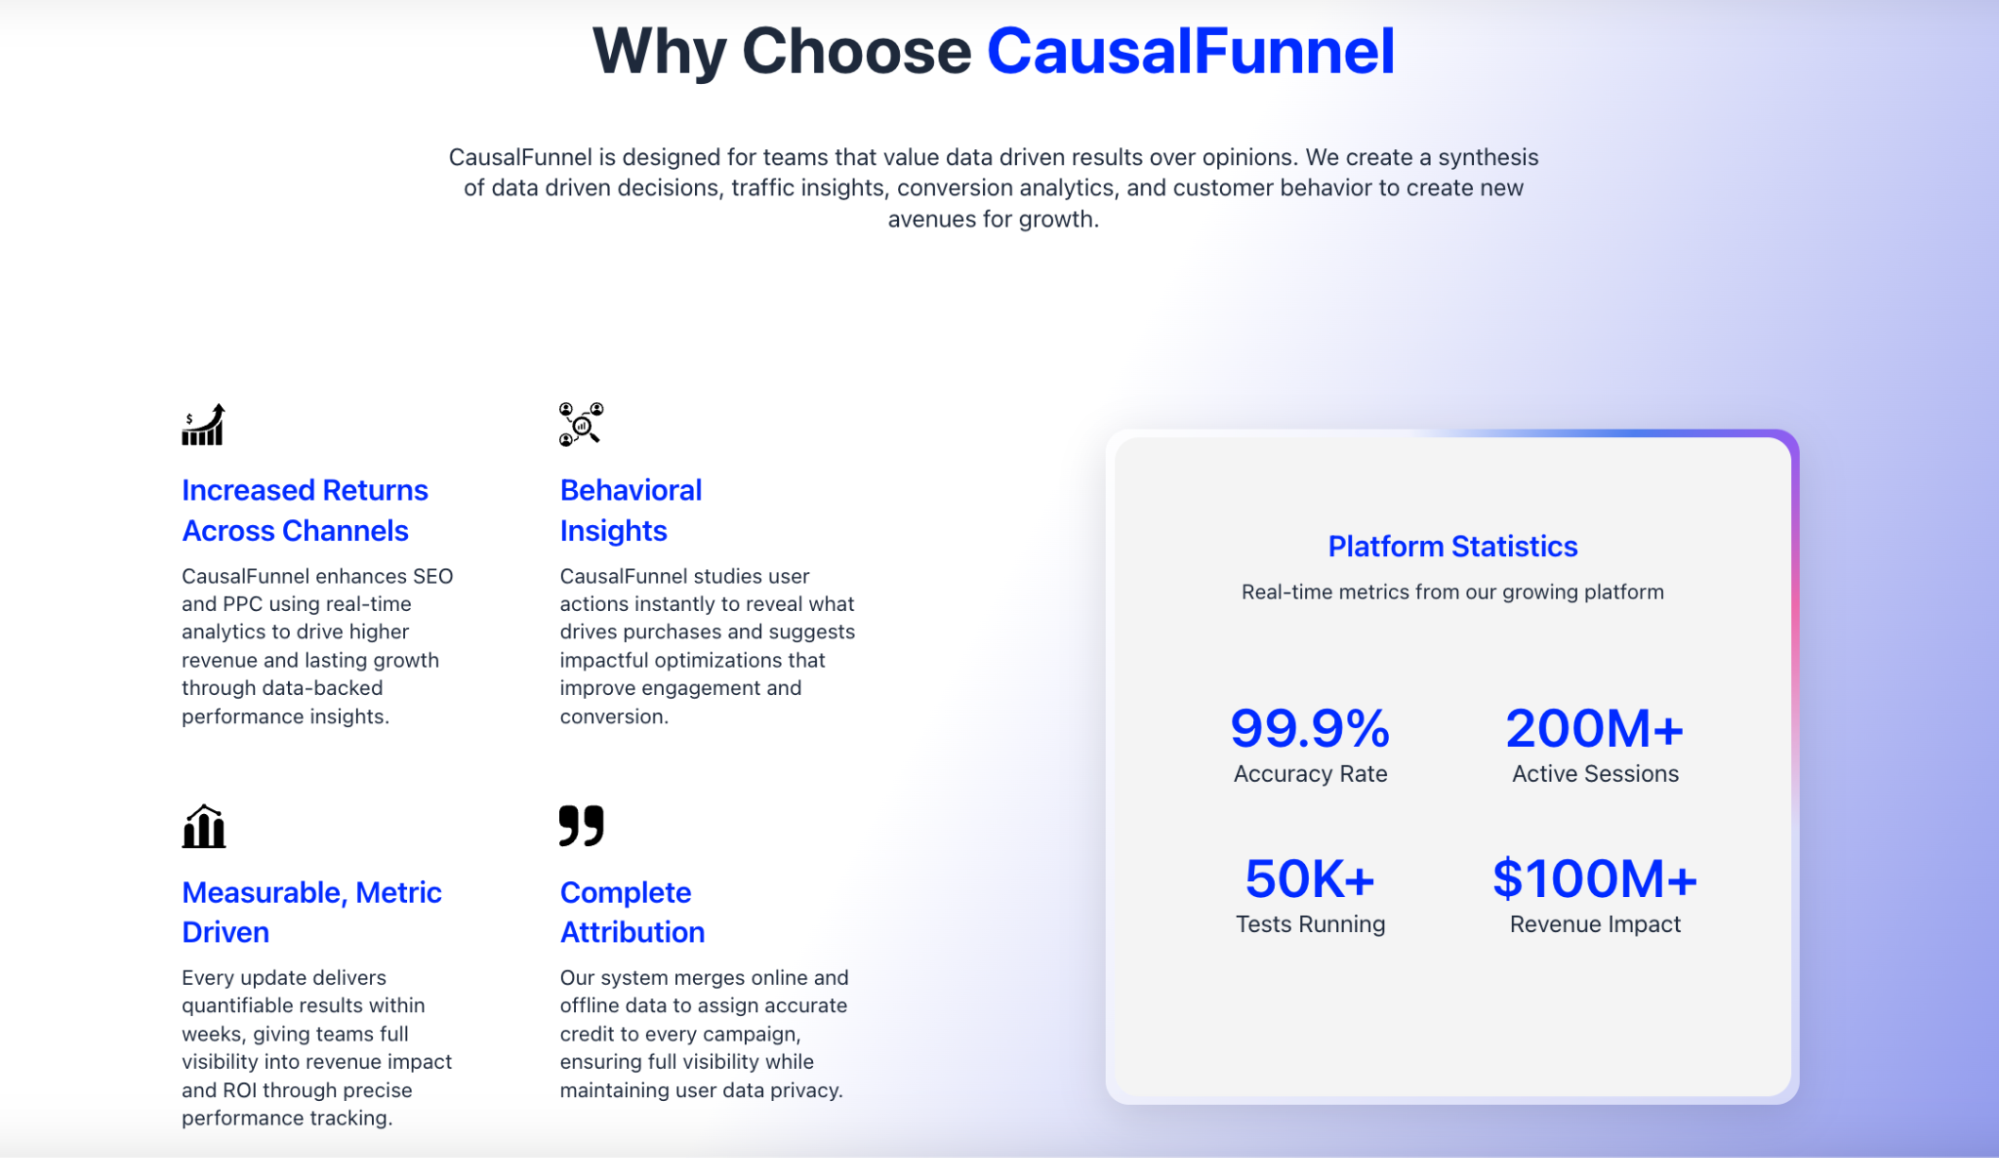
Advanced platforms like CausalFunnel also help businesses analyze customer behavior more deeply. Their services include AI-based audience segmentation, conversion funnel analysis, predictive insights, and cookieless tracking solutions. These features help businesses understand customer intent better and improve campaign performance faster.
Businesses should focus on understanding trends instead of collecting endless reports continuously. Too much reporting often creates confusion and delays decision-making unnecessarily.
This stage also helps businesses discover growth opportunities they previously overlooked completely. For example, businesses may notice certain products sell better during specific seasons. Those insights improve inventory planning, marketing campaigns, and customer targeting significantly.
The goal of analysis is not creating beautiful charts alone. Businesses should use insights to improve decisions, customer experiences, and overall performance consistently.
Data analysis becomes useless when businesses ignore the insights completely afterward. You see real business growth only when companies take meaningful action consistently.
Many businesses create reports regularly but never apply the findings practically. That mistake prevents businesses from improving marketing, sales, and customer experiences effectively. Businesses should review findings carefully and identify important improvement opportunities first.
Useful actions may include:
For example, a business may notice customers abandoning checkout pages frequently. After analyzing behavior data, they discover complicated payment processes caused frustration.
The company simplifies checkout steps and improves conversion rates quickly afterward. I is important that businesses follow a simple action process after completing analysis.
Testing improvements matters because not every change guarantees better results immediately. Businesses should compare performance before and after adjustments carefully.
For example, a company may test two different email subject lines separately. The better-performing version can then become the permanent campaign strategy.
Businesses should also monitor results regularly after implementing new strategies consistently. Continuous tracking helps companies understand whether changes improve business performance successfully.
Many businesses today use dashboards to monitor ongoing business growth metrics easily. Real-time tracking helps businesses respond faster to customer behavior changes.
This step connects data analysis directly to measurable business growth outcomes clearly. Businesses can improve profits, customer retention, and marketing performance more confidently.
Most importantly, businesses stop relying on assumptions and start making smarter evidence-based decisions consistently.
Many businesses struggle with data analysis because they repeat avoidable mistakes frequently. Even good tools and accurate reports cannot fix poor analysis habits completely.
Here are some common mistakes that businesses make.
One common mistake involves tracking too many metrics simultaneously. Businesses often collect excessive information without understanding which numbers actually matter. This usually creates confusion instead of better decision-making clarity.
Another major mistake involves ignoring data quality problems during reporting stages. Inaccurate or outdated information leads to misleading business conclusions quickly.
Businesses should regularly check for:
Some businesses also begin analysis without defining clear business goals first. Without direction, teams often analyze random information without meaningful outcomes afterward.
Using outdated data creates additional problems for growing businesses consistently. Customer behavior changes regularly, especially during changing market conditions and industry trends. Businesses should avoid relying heavily on old reports and assumptions continuously.
Another frequent mistake involves misreading business trends completely. Short-term performance changes do not always represent long-term business patterns accurately.
For example, temporary traffic spikes may result from seasonal events instead of marketing improvements.
Businesses also focus too heavily on vanity metrics sometimes. Numbers like social media followers may look impressive publicly but rarely improve profits directly.
Useful analysis focuses on metrics connected to business growth and customer behavior clearly.
Avoiding these mistakes helps businesses make better decisions and improve reporting accuracy significantly.
Modern tools make business data analysis much easier for beginners today. Businesses can now get access to many platforms that offer simple dashboards, reports, and automated tracking features.
Businesses should choose tools based on company size, reporting needs, and technical experience.
Below are the tools included:
Tool | Best For |
Google Analytics | Website tracking |
Excel | Basic reporting |
Tableau | Advanced dashboards |
Looker Studio | Free visualization |
CRM dashboards | Customer tracking |
Businesses should avoid using too many tools simultaneously during early stages as it may confuse them with the data. Simple systems usually work better for beginners learning business data analysis.
The best tool is often the one businesses understand and use consistently. Expensive software alone cannot improve decision-making without proper strategy and reporting habits.
Start with simple tools first and expand gradually as business needs grow.
Business data analysis may seem overwhelming at first for many business owners. However, the process becomes much easier when divided into manageable steps consistently.
Learning how to analyze data for your business in 5 steps helps businesses make smarter decisions confidently. Instead of relying on guesswork, companies use real information to guide growth strategies.
To analyze data, businesses do not need advanced technical skills. Even small improvements in reporting can create valuable business growth opportunities.
Start small, stay consistent, and focus on meaningful business metrics carefully. Over time, better analysis leads to stronger marketing, improved customer experiences, and smarter business growth decisions.
The first step involves defining a clear business goal carefully. Businesses should know exactly what they want to improve first. With clear goals, teams can focus on useful data instead of random information.
KPIs help businesses measure progress using meaningful performance metrics consistently. They show whether business strategies are actually improving important results over time. Without KPIs, businesses often struggle to track performance accurately and consistently.
Beginners can start using simple and affordable reporting tools easily. Popular beginner-friendly tools include:
These tools help businesses organize, visualize, and understand data much faster.
Look for experience, strategy, and transparency. Avoid unrealistic promises, and choose an agency that understands your business goals.
Most businesses should review important performance data regularly every month. However, some businesses monitor campaigns and website activity weekly or daily. The right schedule depends on business size, goals, and reporting needs.
Businesses should collect data connected directly to important business goals consistently. Useful business data may include:
Businesses should avoid collecting unnecessary information without a clear purpose.
Data analysis helps businesses make smarter decisions using real information instead of assumptions. Companies can improve marketing, customer experiences, and operational efficiency more effectively.
Better analysis often leads to:
Yes, small businesses benefit greatly from business data analysis practices consistently. Even simple reporting helps companies understand customer behavior and improve decision-making.
CausalFunnel helps businesses simplify customer journey analysis and performance tracking significantly. Their platform offers AI-powered audience segmentation, funnel analytics, predictive insights, and cookieless tracking solutions. These services help businesses understand customer intent better and improve conversion performance faster.
Start using our A/B test platform now and unlock the hidden potential of your website traffic. Your success begins with giving users the personalized experiences they want.
Start Your Free Trial

Empowering businesses to optimize their conversion funnels with AI-driven insights and automation. Turn traffic into sales with our advanced attribution platform.
Trusted by Customers


©CausalFunnel Inc. All rights reserved.