
")


Free Funnel Audit
Convert more customers today!
SEO
10 mins read

SEO
10 mins read
Today, advertising costs are much more expensive than what it was even a few years ago. With each year advertising becomes more expensive. As a marketer, you don’t want to waste even a single dollar. Thus, it’s essential to know whether your efforts are giving returns or not.
It’s here that the metric ROAS proves helpful. This blog covers everything you must know to use ROAS to measure and optimize your ad spend.
ROAS means return on ad spend. Its a crucial KPI in online marketing. ROAS tells the revenue amount you earn for every dollar spent on the campaign. The KPI is based on the ROI principle. It gives you the profit achieved for every advertising expense. You can measure it on a high level or more nuanced basis.
ROAS measures one important relationship:
Revenue generated from ads compared to advertising cost.
A higher ROAS means advertising produces more revenue for every dollar spent.
Lower ROAS indicates that campaigns generate less revenue relative to cost.
Advertising budgets can grow very quickly. Companies therefore need clear data showing what works.
ROAS helps marketers:
Better decisions become possible when advertising performance is measurable.
Consider the following simple scenario.
ROAS would be calculated as 4.
This means every dollar spent generates four dollars in revenue. That simple number provides valuable insight into campaign performance.
Calculating ROAS requires only two numbers. Those numbers are advertising revenue and advertising cost.
The formula is straightforward and easy to apply.
ROAS = Revenue from Ads ÷ Cost of Ads
This formula measures the relationship between revenue generated and money spent. The result typically appears as a ratio or number. For example, a ROAS of 4 means every dollar spent generates four dollars in revenue.
Revenue from advertising includes all sales generated directly through ad campaigns.
This revenue might come from several sources:
Tracking tools usually attribute this revenue to specific campaigns. Accurate revenue tracking is essential for calculating ROAS correctly.
Ad spend represents the total money spent running advertising campaigns. This amount includes spending across different advertising platforms.
Common examples include:
Marketers often track ad spend daily, weekly, or monthly. Accurate cost data ensures that ROAS calculations remain reliable.
Many guides explain the formula but skip the actual process. Understanding the steps makes the calculation easier and more accurate.
Follow these four steps to calculate ROAS correctly.
Begin by calculating the total amount spent on advertising. Include spending across all advertising platforms involved in the campaign.
Typical sources include:
Marketing dashboards usually track this data automatically. Exporting accurate cost data ensures the final ROAS calculation remains reliable. This is because even small discrepancies in ad spend can significantly distort the calculated return, leading to incorrect conclusions about campaign performance.
Next, determine how much revenue advertising actually generated. Analytics tools attribute purchases or conversions to advertising campaigns.
Common tracking tools include:
Make sure the revenue comes directly from advertising traffic. Incorrect attribution can lead to misleading ROAS numbers.
Now apply the formula using the collected data.
ROAS = Revenue from Ads ÷ Cost of Ads
Divide the total advertising revenue by total ad spend. The result produces the ROAS number.
For example:
Revenue from ads: $1,000
Ad spend: $250
ROAS = 1,000 ÷ 250 = 4
This result means every dollar spent generated four dollars in revenue.
The final step involves understanding what the ROAS value means. Higher numbers usually indicate stronger advertising performance. Lower numbers suggest campaigns may require improvements.
However, interpretation also depends on profit margins and industry benchmarks. Businesses often set minimum ROAS targets based on profitability goals. Evaluating ROAS regularly helps marketers improve campaign efficiency.
Below are several scenarios showing how ROAS works in real situations.
Ad Spend | Revenue | ROAS |
$100 | $400 | 4 |
This campaign generated four dollars for every advertising dollar spent. The result indicates strong advertising efficiency for a small campaign.
Ad Spend | Revenue | ROAS |
$2,000 | $8,000 | 4 |
The e-commerce campaign produced the same ROAS value. Each advertising dollar generated four dollars in revenue. Many e-commerce businesses aim for similar performance levels.
Ad Spend | Revenue | ROAS |
$50,000 | $150,000 | 3 |
The campaign generated three dollars for every dollar spent. Although revenue appears large, the ROAS value remains lower.
Profit margins will determine whether this campaign remains profitable. Large campaigns sometimes accept lower ROAS due to scaling benefits.
What actually counts as a good ROAS? The honest answer depends on several factors. Industry type, profit margins, and business goals all influence the number.
However, general benchmarks still provide helpful guidance. These ranges help marketers evaluate whether campaigns perform well.
Advertising costs have also increased across most platforms in recent years. Competition continues rising across search and social networks.
Because of this shift, many businesses now aim for higher efficiency from their ad budgets.
ROAS | Meaning |
1 | Break-even performance |
2–3 | Average advertising performance |
4+ | Strong campaign performance |
6+ | Excellent advertising efficiency |
These benchmarks provide a starting point for evaluating campaigns.
A ROAS of 1 means revenue equals advertising cost. Every dollar spent produces one dollar in revenue. Businesses rarely aim for this number because no profit remains after other expenses.
A ROAS between 2 and 3 often represents average campaign performance. Many businesses operate within this range during early optimization stages.
A ROAS above 4 usually indicates strong advertising performance. Campaigns generating this level of return often scale successfully.
A ROAS above 6 is considered excellent for most industries. These campaigns generate significant revenue compared with advertising spend.
The advertising landscape continues evolving rapidly. Several factors now influence what counts as a strong ROAS.
First, advertising costs have increased across many platforms. Rising competition drives higher cost-per-click and cost-per-impression values.
Second, privacy regulations have made tracking more complex. Changes such as cookie restrictions and platform privacy updates reduce attribution accuracy.
Because of these factors, marketers now rely more heavily on broader performance metrics. Some businesses therefore accept slightly lower ROAS values when long-term customer value remains strong.
Profit margin remains the most important factor when evaluating ROAS.
Businesses with high margins can operate successfully with lower ROAS values. Companies with thin margins require higher advertising efficiency.
The table below illustrates this relationship.
Profit Margin | Minimum ROAS Needed |
20% | 5 |
30% | 3.3 |
50% | 2 |
Higher margins provide more flexibility when scaling advertising campaigns.
Industry dynamics also influence acceptable ROAS levels.
E-commerce brands often target ROAS above 4 because product margins remain relatively thin.
SaaS companies sometimes accept lower initial ROAS because customer lifetime value becomes very high.
Travel companies occasionally achieve much higher ROAS values due to large booking amounts.
Because of these differences, comparing your performance with industry benchmarks helps provide useful context.
Break-even ROAS represents the minimum value required to avoid losing money. This value depends on the business profit margin. A higher margin allows lower break-even ROAS.
Break-even ROAS = 1 ÷ Profit Margin
Profit margin must be expressed as a decimal.
For example, a 25 percent margin becomes 0.25.
Profit Margin | Break-Even ROAS |
20% | 5 |
25% | 4 |
50% | 2 |
A business with a 25 percent margin requires a ROAS of four. Lower values would result in financial losses. Understanding break-even ROAS helps marketers set realistic campaign targets.
Recent datasets from advertising analytics platforms show large variations across industries. Median ROAS on Google Ads is about 3.31 across industries, although many sectors perform above or below that average.
Below is a simplified table based on multiple 2024–2025 benchmark reports.
Industry | Average / Median ROAS |
2.8 – 4.2 | |
4.5 – 7.7 | |
Legal Services | ~4.2 – 8.2 |
~2.2 – 4.0 | |
~0.9 – 2.3 | |
B2B SaaS | ~1.7 – 3.5 |
Automotive | ~3.8 – 4.8 |
~2.5 – 3.8 | |
~0.7 – 5.8 |
These benchmarks come from aggregated advertising data across thousands of companies and billions in ad spend.
The numbers above highlight an important insight. ROAS performance depends heavily on industry economics.
For example, e-commerce companies often report ROAS around 2.8–4.2, largely due to intense competition and rising advertising costs.
Travel companies sometimes achieve much higher ROAS values because bookings generate large transaction amounts.
Legal services frequently show extremely strong ROAS because one client can generate significant revenue.
On the other hand, industries with long buying cycles often show lower ROAS numbers. Real estate and financial services fall into this category.
Advertising platforms also influence ROAS outcomes. Industry research shows the following typical platform benchmarks:
Advertising Platform | Typical ROAS |
Google Ads (median) | ~3.31 |
Facebook / Meta Ads | ~2.19 |
Influencer Marketing | ~3.45 |
Email Marketing | ~3.50 |
Search advertising usually performs better because users already show purchase intent. Social platforms often generate discovery and awareness instead.
ROAS benchmarks also vary across advertising platforms. Each platform attracts different audiences and user behavior.
Some platforms capture users ready to purchase. Other platforms focus more on discovery and brand awareness.
Because of this difference, ROAS performance can vary significantly between platforms. Understanding these benchmarks helps marketers choose the right channel.
Industry benchmark studies show that search advertising usually delivers higher ROAS than social media advertising. However, social platforms often generate demand earlier in the customer journey.
The table below summarizes typical ROAS benchmarks across major advertising platforms.
Advertising Platform | Typical ROAS Range | What It Usually Means |
Google Ads | 3.0 – 4.0+ | Strong purchase intent traffic |
Meta (Facebook Ads) | 2.0 – 3.0 | Balanced discovery and conversion |
Instagram Ads | 2.0 – 3.5 | Strong visual product performance |
LinkedIn Ads | 1.5 – 3.0 | Higher B2B lead value |
TikTok Ads | 1.5 – 2.5 | Discovery-focused campaigns |
Google Ads often produces the highest ROAS among major advertising platforms.
Search campaigns target users actively looking for solutions. Because intent already exists, conversions happen more frequently.
Industry reports estimate average Google Ads ROAS around 3.0 to 4.0 across most industries. Some e-commerce businesses even achieve ROAS above five with strong optimization.
Shopping campaigns and branded search keywords usually perform especially well.
Meta advertising includes Facebook and Messenger placements. These campaigns typically generate ROAS between 2.0 and 3.0.
Facebook ads often work well for e-commerce products and impulse purchases. However, users on social platforms usually browse casually rather than search for products. Conversion rates therefore remain slightly lower than search advertising.
Still, strong creative and targeting can significantly improve results.
Instagram advertising often performs well for visually appealing products. Fashion, beauty, travel, and lifestyle brands frequently generate strong results on the platform.
Benchmark studies show Instagram ROAS typically falls between 2.0 and 3.5. Influencer partnerships and visual storytelling often improve these numbers.
Instagram also benefits from strong mobile engagement and younger audiences.
LinkedIn advertising targets professionals and business decision makers.
Campaign costs remain higher compared to most social platforms. However, B2B customers often generate significantly higher lifetime value. Because of this dynamic, LinkedIn ROAS often ranges between 1.5 and 3.0.
Although the initial ROAS may appear lower, high-value enterprise deals can make campaigns profitable over time.
TikTok advertising focuses heavily on discovery and entertainment.
Users rarely open the platform intending to purchase immediately. Instead, products gain attention through engaging short-form videos.
Benchmark reports show TikTok ROAS usually ranges between 1.5 and 2.5. However, viral content can dramatically outperform these averages. Brands targeting younger audiences often achieve strong performance on TikTok.
The numbers above reveal a useful pattern.
Platforms with strong purchase intent usually produce higher ROAS. Platforms focused on discovery often deliver lower initial returns. However, those discovery platforms still play an important role in marketing strategy.
Many businesses therefore use multiple platforms together. Search ads capture demand while social ads create it.
Understanding these differences helps marketers allocate budgets more effectively.
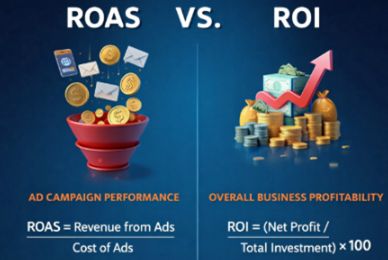
ROAS and ROI often confuse marketers because both measure returns.
However, the two metrics focus on different financial questions.
Metric | Measures |
ROAS | advertising campaign performance |
ROI | overall business profitability |
ROAS measures how efficiently advertising generates revenue.
ROI measures overall profitability after all business costs.
For example, a campaign might show high ROAS but low ROI. This situation occurs when operational costs reduce profit margins. Marketers usually monitor both metrics together.
ROAS helps optimize advertising while ROI reflects broader financial health.
Blended ROAS gives a broader view of marketing performance. Instead of looking at one campaign or platform, it measures the return from all advertising combined.
Marketers often calculate ROAS separately for Google Ads, Meta Ads, or TikTok campaigns. Those numbers help evaluate individual platforms.
However, customers rarely interact with only one channel. Many people discover a brand on social media and later purchase through search.
Because of this behavior, single-platform ROAS can sometimes feel misleading. Blended ROAS solves this problem by measuring the total return across all marketing channels.
The formula remains very similar to standard ROAS.
Blended ROAS = Total Revenue ÷ Total Advertising Spend
The key difference is that you include all marketing channels together.
These channels may include:
Instead of evaluating each platform separately, blended ROAS shows the full picture.
Imagine a company running ads across several platforms.
Platform | Ad Spend |
Google Ads | $5,000 |
Meta Ads | $3,000 |
TikTok Ads | $2,000 |
Total advertising spend equals $10,000.
Suppose those campaigns generate $40,000 in total revenue.
Now apply the blended ROAS formula.
Blended ROAS = 40,000 ÷ 10,000 = 4
This result means the entire marketing program generated four dollars for every dollar spent.
Blended ROAS reflects how modern customer journeys actually work.
Most buyers interact with several touchpoints before making a purchase. A customer might see a TikTok video, click an Instagram ad later, and finally convert through Google search.
If you only measure the final channel, the earlier marketing efforts appear ineffective.
Blended ROAS captures the value of the entire advertising ecosystem.
Blended ROAS becomes especially useful in multi-channel marketing strategies.
Companies commonly use this metric when they run campaigns across many platforms.
Typical situations include:
Blended ROAS helps marketers evaluate the combined impact of all advertising efforts.
Both metrics remain important, although they answer different questions.
Metric | What It Measures |
Channel ROAS | performance of one advertising platform |
Blended ROAS | overall marketing efficiency |
Channel ROAS helps optimize specific campaigns. Blended ROAS helps determine whether the overall marketing strategy works. It is recommended to track both metrics together.
Blended ROAS often appears lower than individual platform ROAS. This difference happens because blended calculations include more spending.
Brand campaigns, awareness campaigns, and experimentation budgets all contribute to the total cost.
Those campaigns may not generate immediate revenue. However, they still support long-term growth.
Because of this effect, blended ROAS provides a more realistic view of marketing performance.
Start by tracking both platform ROAS and blended ROAS regularly.
Platform metrics help you optimize campaigns quickly. Blended ROAS ensures your entire marketing strategy remains profitable.
Together, these numbers provide a clearer picture of advertising success.
To calculate ROAS accurately and realistically, include every advertising-related expense.
For example, consider a campaign with the following costs:
Cost Type | Amount |
Ad platform spend | $5,000 |
Agency fees | $1,000 |
Creative design | $500 |
Software tools | $200 |
Total advertising cost equals $6,700.
Using only platform spend would underestimate true advertising cost. Accurate calculations lead to better marketing decisions.
Improving ROAS requires more than increasing ad spend. The real goal is to generate more revenue from the same budget.
Most successful marketers focus on two areas. First, they improve advertising performance. Second, they increase conversion efficiency after users click the ad.
Below are practical ways to improve ROAS using modern advertising strategies.
Better targeting increases the chances that ads reach the right audience.
When ads reach interested users, conversions happen more frequently. Advertising platforms offer many targeting options that help refine audiences.
Common targeting options include:
Accurate targeting reduces wasted ad spend. As a result, each advertising dollar produces more revenue.
Every advertising platform works differently. Campaign strategies should therefore adapt to each platform.
Below are common tactics used across major advertising networks.
Platform | Optimization Strategy |
Google Ads | Focus on high-intent keywords and search campaigns |
Meta Ads | Use lookalike audiences and strong creatives |
Instagram Ads | Prioritize visual storytelling and product imagery |
LinkedIn Ads | Target specific job roles and industries |
TikTok Ads | Use short-form video and creator-style content |
Search platforms usually capture demand from users already looking for solutions. Social platforms help create demand earlier in the buying journey.
Balancing both strategies often improves overall marketing performance.
Landing pages play a major role in advertising success. Even strong ads fail when the landing experience feels confusing.
A good landing page should clearly continue the promise made in the ad. For example, if an ad promotes a discount, the landing page should immediately show that offer.
Several elements influence landing page performance:
Improving landing pages increases conversion rates. Higher conversion rates naturally improve ROAS.
Search advertising performs best when targeting keywords with strong purchase intent. Users searching with specific phrases usually show stronger buying interest.
For example, the keyword “buy running shoes online” often converts better than “running shoes”. Marketers often improve ROAS by removing weak keywords. Eliminating low-performing terms reduces wasted spending.
Regular keyword analysis helps identify the most profitable search queries.
First-party data has become increasingly important in modern advertising. Privacy changes and cookie restrictions have reduced access to third-party tracking data. Because of this shift, businesses now rely more on their own customer data.
First-party data typically includes:
Advertising platforms allow businesses to upload this data for audience targeting. These audiences often perform better because they already know the brand.
For example, companies often create lookalike audiences based on existing customers. Platforms then find similar users who are more likely to convert. This strategy frequently improves campaign efficiency.
ROAS improves when each customer generates more revenue over time.
Many businesses focus only on the first purchase. However, repeat purchases often produce the highest profit. Encouraging long-term relationships increases the total value of each customer.
Common strategies include:
Higher lifetime value allows companies to spend more on advertising while maintaining profitability.
Creative elements strongly influence advertising performance. Images, headlines, and videos all affect engagement and conversion rates.
Marketers therefore test multiple creative variations during campaigns. Typical elements tested include:
Running several variations helps identify which creative resonates with the audience. Advertising platforms often rotate creatives automatically to find the best performers. Continuous testing gradually improves campaign results.
Accurate tracking is essential when optimizing ROAS. Without reliable data, marketers cannot identify which campaigns actually generate revenue.
Several tools help improve tracking accuracy:
Better tracking allows marketers to allocate budgets toward high-performing campaigns. As a result, overall ROAS improves steadily over time.
ROAS rarely improves through one change alone.
Instead, marketers gradually optimize several campaign elements. A small improvement in targeting increases click quality. Better landing pages improve conversion rates.
Stronger creatives attract more engagement from the right audience. Together, these improvements significantly increase advertising efficiency.
Over time, consistent optimization often produces the strongest ROAS growth.
Although ROAS remains useful, the metric does not always tell the full story. Certain situations require additional context when interpreting results.
Brand awareness campaigns focus on visibility rather than immediate revenue. ROAS may appear low even though long-term brand value increases.
Businesses with long purchasing cycles may generate revenue weeks later. Immediate ROAS calculations might underestimate campaign impact.
Subscription companies often prioritize long-term customer value. Initial purchases may produce low ROAS while lifetime value remains high.
ROAS provides valuable insights but should never exist alone. Other metrics help marketers understand broader marketing performance.
ROI measures overall profitability after accounting for total costs.
CPA shows how much it costs to acquire one customer.
This metric estimates the total revenue a customer generates over time.
Conversion rate measures the percentage of visitors completing a desired action.
Understanding how to calculate ROAS helps businesses evaluate advertising performance clearly.
The formula remains simple and easy to apply.
ROAS = Revenue from Ads ÷ Cost of Ads
This calculation shows how much revenue advertising generates relative to cost. Marketers often use ROAS to compare campaigns, optimize budgets, and improve marketing strategy.
However, the metric works best when combined with other performance indicators. Tracking metrics like ROI, CPA, and customer lifetime value provides deeper insight.
Use the ROAS calculator whenever you need quick campaign analysis. Regularly measuring ROAS helps businesses make smarter advertising decisions.
ROAS calculation requires dividing advertising revenue by advertising cost. Many marketers also use online calculators for faster results.
Many e-commerce businesses aim for a ROAS of four or higher. Actual targets depend heavily on product margins and operational costs.
ROAS measures advertising performance while ROI measures overall profitability. Both metrics serve different purposes and should be analyzed together.
ROAS cannot technically become negative because revenue cannot fall below zero. However, extremely low revenue values produce ROAS close to zero.
ROAS focuses only on revenue generated from advertising spend. Profit margin becomes relevant when calculating break-even ROAS or overall ROI.
Start using our A/B test platform now and unlock the hidden potential of your website traffic. Your success begins with giving users the personalized experiences they want.
Start Your Free Trial
Empowering businesses to optimize their conversion funnels with AI-driven insights and automation. Turn traffic into sales with our advanced attribution platform.
Trusted by Customers


©CausalFunnel Inc. All rights reserved.