
")


Free Funnel Audit
Convert more customers today!

SEO
10 mins read

SEO
10 mins read
Pricing decisions shape your store’s revenue more directly than almost any other variable. A dollar difference might seem insignificant until you realize it compounds across thousands of transactions. The challenge isn’t just picking a number; it’s understanding how customers perceive value, how psychological triggers influence decisions, and how small presentation changes can shift conversion rates without sacrificing margin.
This guide walks you through setting up pricing experiments in CausalFunnel, explaining not just the mechanics but the reasoning behind each decision.
Most merchants change prices based on intuition or competitor research. The problem is that every audience responds differently. What works for a competitor’s customer base might fail with yours. What converts in one season might underperform in another.
Pricing tests remove guesswork by measuring actual buying behavior under controlled conditions. If a test reveals that displaying “$47” instead of “$49.99” lifts conversions by 8% without reducing average order value, that insight scales across every future sale. On a product generating 500 monthly orders, an 8% lift means 40 additional sales. Over a year, that compounds significantly.
Beyond revenue, pricing tests reveal customer psychology. You learn which formats build trust, which create perceived value, and which accidentally signal cheapness.
A pricing test isolates one variable: how price is displayed or what amount is shown. Everything else remains constant; the product, images, description, reviews, and layout stay untouched. This isolation makes the test valid. Any conversion difference stems from the pricing change, not other factors.
This focus creates power but also limitations. Pricing tests answer questions about willingness to pay and perception, but they don’t explain why customers prefer one format. Tests also require patience. You’re measuring purchase decisions, which happen less frequently than pageviews. A valid result might require several hundred completed transactions per variant.
Finally, these tests work best when the price change is meaningful but not drastic. Testing $50 against $45 makes sense. Testing $50 against $25 introduces too many variables; customers might question product quality at the lower price. Keep variations within a realistic range where the core value proposition stays intact.
Timing matters. Launch during a major sale period, and results get distorted by promotional traffic. Run during an inventory shortage, and low stock warnings interfere with price perception. The best testing windows occur during stable periods when traffic patterns are predictable.
New product launches present ideal testing opportunities. You haven’t established a reference price yet, so customers have no anchor. Testing $79 against $89 from day one lets you find the optimal entry point before habits form.
Underperforming products also benefit from experiments. If a product gets traffic but doesn’t convert, the price might be the barrier. Testing a lower point reveals whether the issue is affordability or something else entirely.
High-volume products justify testing even small changes. When a product generates significant daily sales, a 3% conversion improvement translates to substantial revenue.
Avoid testing during major promotional periods, when running other tests on the same product, during inventory fluctuations, right after a recent price change, or when traffic is too low to reach statistical significance within a reasonable timeframe.
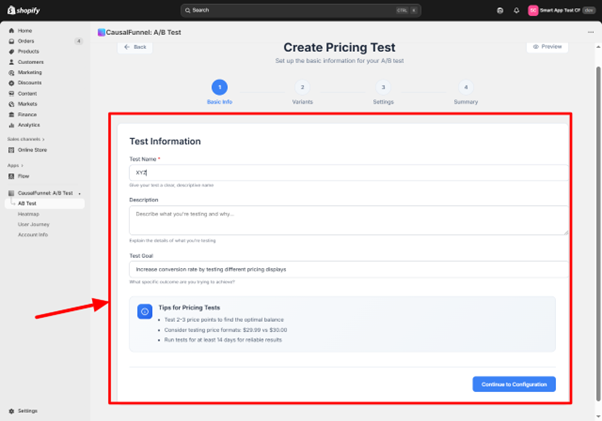
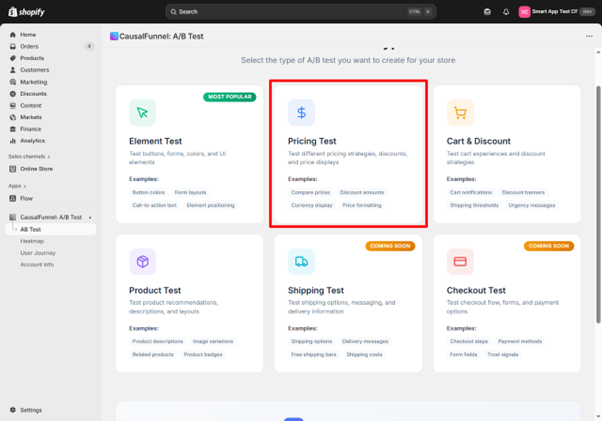
When you select the Pricing Test from the CausalFunnel dashboard, the first screen asks for basic information that frames the entire experiment.
The test name field isn’t just administrative; it’s how you’ll identify this experiment among dozens of others later. A name like “Pricing Test 7” tells you nothing six months from now.
Build names that capture three elements: the product, the variable being tested, and the price points. “Winter Jacket: $89 vs $99” immediately communicates what you tested. “Leather Wallet: Charm vs Round Pricing” describes the psychological angle. This specificity matters when you scale testing and need to find precedents quickly.
The description box captures why you’re running this test and what hypothesis you’re validating. A useful description answers: What pricing change are you testing? Why did this test become a priority? What outcome would make you adopt the variant?
Example: “Testing whether charm pricing ($29.99) outperforms round pricing ($30) on our best-selling candle. Competitor research suggests charm pricing is standard in home goods, but our brand emphasizes premium quality. Will adopt the winner if conversion lift exceeds 5% without impacting average order value.”
This documentation becomes valuable when you review results and need to remember your original decision criteria.
The goal dropdown determines what CausalFunnel measures as success. Conversion rate is the default; it measures the percentage of visitors who complete a purchase. Use this when you’re testing products with straightforward purchase paths priced under $150.
Add-to-cart rate measures initial interest without requiring completed purchases. Use this for high-consideration products priced above $200 where most purchases happen 2+ days after first visit.
Average order value measures typical cart totals. Use this for consumables or products bought in multiples, where price changes might affect quantity purchased more than conversion rate.
CausalFunnel highlights several guidelines before you proceed. Testing two to three price points keeps experiments manageable. More variants require dramatically more traffic and time. Small format changes like $29.99 versus $30 often reveal big patterns; charm pricing signals deals while round numbers convey quality. Running tests for at least two weeks smooths out weekly patterns, capturing both weekend and weekday shoppers across two complete cycles.
After saving basic information, CausalFunnel moves you to product selection. A search bar lets you find products by name, SKU, or product ID. Type a few characters and matching products appear below.
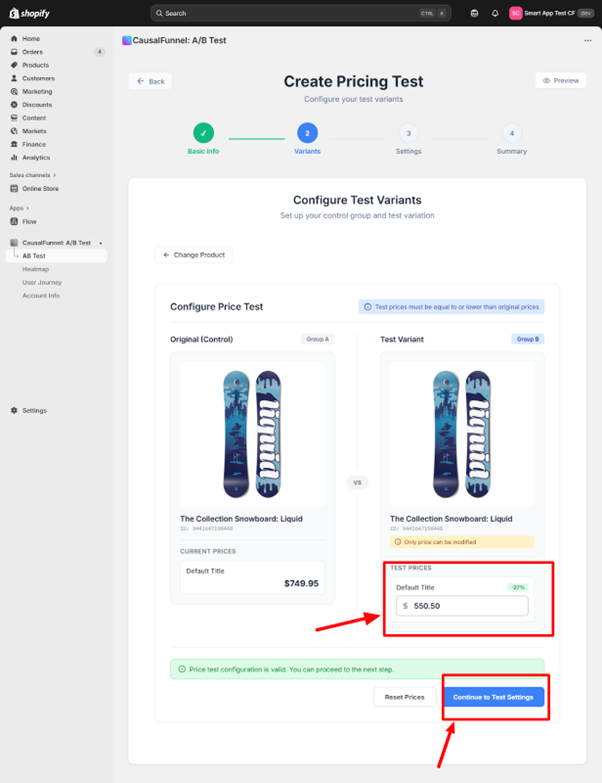
The configuration screen splits into two panels. The left shows the control group; your product exactly as it currently appears in your store. Everything is locked except the price field, since pricing tests isolate only this variable.
The right shows the test variant; this is where you enter the alternate price. CausalFunnel requires that test prices be equal to or lower than the original. Testing price increases carries risk, if conversions drop significantly, you’ve potentially damaged customer trust during the experiment.
As you enter the test price, consider the gap size. Testing $50 against $49.50 creates such minimal difference that any conversion change might be statistical noise. Aim for at least a 10% difference on products under $100, and at least 5-7% on products above $100.
For products at $40, test against $36 rather than $39. For products at $150, test against $140 rather than $148. Format differences are the exception—testing $29.99 versus $30 is valid despite the one-cent gap because you’re testing perception rather than absolute value.
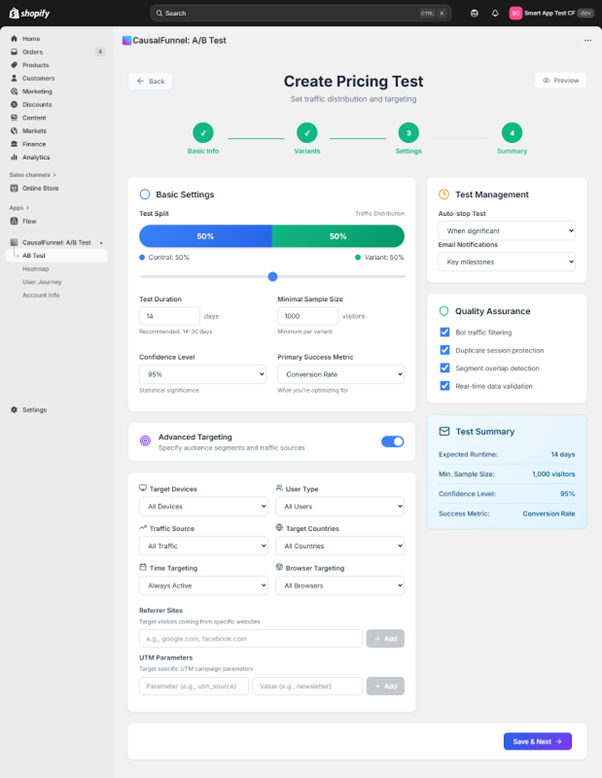
The settings screen controls how the test runs. Every option here influences data quality, so this section requires careful attention.
The traffic split defaults to 50/50; half see the original price, half see the test price. This balanced split is optimal because both versions get equal exposure. You can adjust percentages if needed, but uneven splits require more total traffic to collect the same sample size per variant. Most merchants should stick with 50/50.
The default is fourteen days. This isn’t arbitrary; it captures two complete weekly cycles, including two weekends and two mid-week periods, averaging out random fluctuations. For high-consideration products or lower-traffic stores, extend to thirty days. Products priced above $200 often have longer purchase cycles where customers visit multiple times before buying.
This setting defines how many visitors each variant must receive before the test can be considered complete. The default is 1,000 per variant based on statistical power calculations. This gives the test enough power to detect conversion differences of 3-5 percentage points.
However, appropriate sample size depends on your baseline conversion rate. Products with very low conversion (under 1%) need larger samples. Check your product’s typical daily traffic; if it gets 200 visitors per day, a 1,000-per-variant test needs about ten days. If it gets only 50 visitors per day, the same test needs forty days.
Locked at 95%, this represents how certain the system must be before declaring a winner. A 95% confidence level means only a 5% chance that the observed difference is due to random luck. Most merchants should leave this at 95%; it’s the industry standard that balances certainty with practical test duration.
This dropdown determines which metric CausalFunnel optimizes for. Choose based on your product and goals:
Below basic settings are optional filters controlling who enters the test. By default, all filters are open for broad sampling. However, specific situations justify targeted tests:
Device targeting restricts to desktop or mobile. Use when mobile and desktop experiences differ significantly or when analytics show dramatically different conversion rates per device.
User type filtering separates new visitors from returning customers. Use new visitor targeting when establishing pricing for newly launched products or understanding first-impression responses. Use returning customer targeting when testing whether price reductions win back previous visitors.
Traffic source filters segment by origin: organic search, paid ads, direct traffic, or referrals. Use when different channels attract different audience segments. If Facebook ads target discount-seekers while organic traffic skews premium, test lower prices only on ad traffic.
Geographic targeting narrows to specific countries or regions. Use when testing currency display formats, when different regions have dramatically different purchasing power, or when considering region-specific pricing strategies.
UTM parameter targeting is powerful for merchants running sophisticated campaigns. Use when testing pricing as part of specific campaigns, when different campaigns target different audience segments, or when wanting to test discount messaging against straight pricing for the same campaign.
Auto-stop ends the test automatically when statistical significance is reached. Enable when you want to minimize wasted traffic on losing variants. Disable when you prefer running the full predetermined period regardless of early results to avoid false positives from early random patterns.
Email notifications send alerts when major milestones occur: test launch confirmation, when significance is reached, and when the test ends. Enable if you’re running multiple concurrent tests or if the timeline is long enough that you might forget to check results.
On the right side, a summary panel displays every choice you’ve made. Review it carefully: Does the expected duration align with your decision timeline? Is the minimum sample achievable given your traffic levels? Are you comfortable with 95% confidence? Does the primary metric actually measure your success goal? Is the 50/50 split appropriate? Have you narrowed the audience appropriately?
The last screen presents a complete overview before real customer traffic enters the experiment. Take time to review each section; once live, changing settings requires stopping and restarting, which wastes collected data.
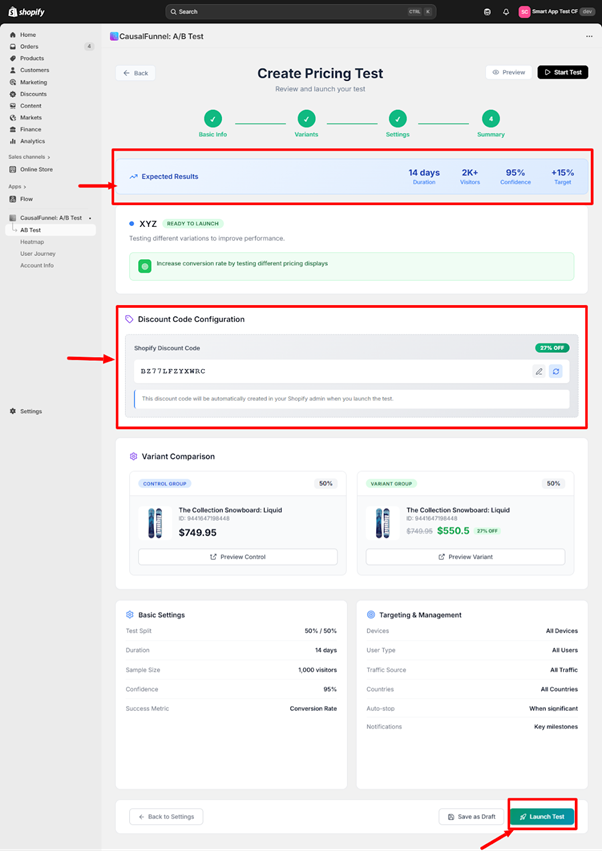
At the top, CausalFunnel displays a projected summary: planned duration, expected total visitors based on historical traffic, confidence level, and improvement target.
The improvement target is calculated from your baseline conversion rate and minimum detectable effect. If your product converts at 3% and the test is powered to detect a 0.5 percentage point lift, the target shows 3.5%.
Check whether expected visitor count aligns with your sample size requirement. If the tool projects 1,800 visitors over 14 days but you set a minimum sample at 1,000 per variant (2,000 total), the test will run longer than two weeks.
This field lets you attach a discount code to purchases made under the test variant, enabling precise tracking of which sales came from which group. Enter a unique code like “PRICETEST2024B” that isn’t currently active in Shopify. CausalFunnel automatically creates this code when you launch and applies it to variant group purchases at 0% off; invisible to customers but valuable for tracking.
The middle section displays both variants side by side exactly as they’ll appear to visitors. Each panel shows product name, product ID, and pricing structure. Preview buttons let you verify that display formatting matches expectations; check that currency symbols appear correctly, decimal points format properly, and any strikethrough or comparison pricing renders as intended.
The tool lists every setting you configured: traffic distribution percentage, test runtime and end date, minimum sample size per variant, confidence level requirement, primary success metric, every targeting filter and its value, auto-stop status, and email notification preferences. Scan this looking for anything wrong; common issues include targeting filters that are too restrictive, sample size too high given traffic levels, runtime too short to collect adequate data, or primary metric that doesn’t match your actual goal.
Once you click “Launch Test,” CausalFunnel creates the discount code in your Shopify admin, begins randomly assigning visitors to control or variant groups based on your traffic split, and activates tracking pixels to monitor product page views, add-to-cart events, and completed purchases. The test becomes active immediately; the next visitor enters the experiment.
If you’re not ready to launch immediately, “Save as Draft” stores your entire configuration without activating the test. Use this when preparing multiple tests for sequential launch, needing approval from a team member, wanting to set up in advance for specific timing, or still finalizing details.
Once running, resist checking results hourly. Early data is noisy; dramatic conversion differences in the first 100 visitors often disappear by day three. Wait until at least 25% of your minimum sample size is collected before drawing conclusions.
Focus on the significance level in the dashboard. Until this reaches your threshold (usually 95%), the test hasn’t produced a reliable answer. If the test runs longer than expected and significance isn’t improving, you can extend duration, lower the confidence threshold (if comfortable with less certainty), or accept inconclusive results; recognizing that the price difference doesn’t meaningfully affect behavior is valuable information.
When your test reaches significance or completes its duration, the results dashboard displays the outcome. Understanding how to interpret these results determines whether you extract value or misapply findings.
The primary display shows conversion rates for each variant along with percentage difference. A typical result: Control (original price) 3.2% conversion, Variant (test price) 3.7% conversion, Lift +15.6% (significant at 95% confidence).
However, check secondary metrics:
Before implementing the winning variant, consider what else happened during the test period: competitor activity, seasonality, traffic quality changes, inventory signals, or reviews/ratings changes. If major external factors affected the test, consider running a follow-up validation during a cleaner period.
Project what implementation would mean for revenue. Example: Current monthly product page visitors 6,000, current conversion 3% (180 sales), current price $50, current monthly revenue $9,000. The test showed a variant price of $45 lifted conversion to 3.5%: new expected sales 210 per month, new expected revenue $9,450 monthly (+$450 monthly or $5,400 annually).
Now factor in margin. If cost per unit is $25: current monthly profit 180 × $25 margin = $4,500, new monthly profit 210 × $20 margin = $4,200 (−$300 monthly). In this scenario, lower price increases revenue but decreases profit. Whether to implement depends on your goals—market share and customer acquisition versus profit optimization.
Different products and situations call for different testing approaches.
When launching a new product, you have no historical data to guide pricing.
If a product gets traffic but doesn’t convert, price might be the barrier.
When optimizing price presentation without changing the actual amount.
If you sell products commonly purchased in multiples.
The test isn’t reaching significance: Sample size too small for the conversion difference, actual rates too similar, or high variance creating noise. Solutions: extend duration, lower confidence threshold to 90% (if acceptable), or accept that price difference doesn’t meaningfully affect behavior.
One variant getting uneven traffic: Check if traffic sources changed during test period, verify traffic split setting saved correctly, or contact support if discrepancy exceeds 10%.
Conversion rate dropped for both variants: Check for external market factors, seasonal downturn, changes to product page outside the test, or traffic source shifts. Review Google Analytics for changes, check for competitor activity, and consider stopping to rerun during a more stable period.
Results conflict with intuition: Price increases can enhance perceived value for certain product categories, lower prices can trigger quality concerns, or high prices can filter out window shoppers. Run a validation test to confirm surprising results and review qualitative feedback for mentions of pricing perceptions.
Pricing tests work best when they’re part of an ongoing optimization process, not one-off experiments. Start with your highest-traffic products; these produce results fastest and have the largest revenue impact. Once comfortable with the process, expand testing to medium-traffic products and new launches.
Resist testing everything simultaneously. Running multiple pricing tests at once fragments traffic and extends completion time. Sequential testing produces cleaner data and lets you apply learnings progressively.
Most importantly, trust the data over intuition. It’s tempting to override test results when they contradict assumptions, but that defeats the purpose. The market is telling you something valuable; listen to it.
Document every test: product tested, price points compared, duration and dates, results, context during the test period, and decision made. After running 5-10 tests, patterns emerge that accelerate future decision-making. These insights compound over time, letting you make more informed pricing decisions even without testing every single change.
Pricing optimization is never finished. Customer preferences shift, competitors adjust positioning, and market conditions evolve. Merchants who consistently outperform are those who test continuously, document thoroughly, and implement decisively.
Multisite for SEO is managing search optimization across multiple connected websites. Each site shares strategy, authority, and content guidelines. It helps businesses scale while maintaining strong rankings.
Yes, even small businesses benefit if planning multiple websites. Coordinated strategy ensures sites support each other. Proper setup prevents wasted effort and improves search visibility.
Use centralized analytics to track traffic, engagement, and conversions. Compare metrics across sites to identify strengths and weaknesses. Regular reporting ensures informed SEO decisions.
Audit at least quarterly or whenever adding a new site. Check content, links, technical SEO, and analytics. Proactive auditing prevents performance drops and long-term issues.
Avoid over-fragmenting domains, poor internal linking, duplicate content, and siloed execution. Maintain consistent technical setup and coordinated analytics.
Yes, coordinated sites strengthen authority and visibility. This drives consistent traffic, higher engagement, and better quality leads. Long-term results are stronger than isolated single-site SEO.
Multisite SEO ensures multiple websites work together rather than compete. It improves authority, user experience, and search engine visibility. Long-term traffic and leads increase when sites are coordinated properly.
Subdirectories consolidate authority under one domain, usually helping rankings. Subdomains separate content but may divide authority. The choice depends on business goals and scalability needs.
Assign unique keyword themes to each site. Ensure content angles differ and link primary pages strategically. Regular audits detect duplication before it affects rankings.
Start using our A/B test platform now and unlock the hidden potential of your website traffic. Your success begins with giving users the personalized experiences they want.
Start Your Free Trial
Empowering businesses to optimize their conversion funnels with AI-driven insights and automation. Turn traffic into sales with our advanced attribution platform.
Trusted by Customers


©CausalFunnel Inc. All rights reserved.